Total Score — Over / Under
Combined score across 100,000 simulated versions of this game, against six fixed lines, centered on the real market total (226.5). The real combined score was 223.
O/U LINE 210
82% over ✓18% under
O/U LINE 220
64% over ✓36% under
O/U LINE 230 MARKET LINE
42% over58% under ✓
O/U LINE 240
23% over77% under ✓
O/U LINE 250
10% over90% under ✓
O/U LINE 260
3% over97% under ✓
Starter Grades
Season-to-date Basketball-Reference stats for each team's starters, minimum 25% of that team's games started.
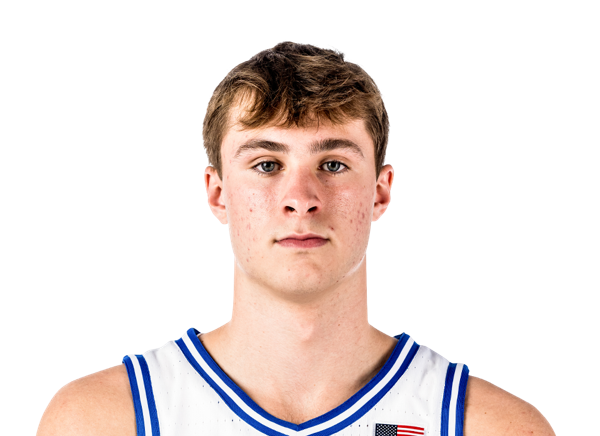
Cooper FlaggSF
25.2
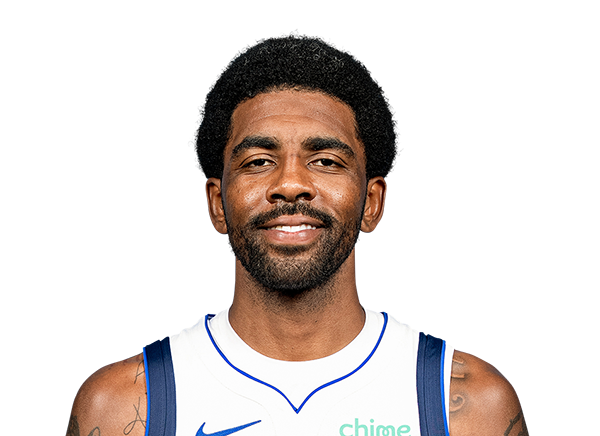
Kyrie IrvingPG
21.4
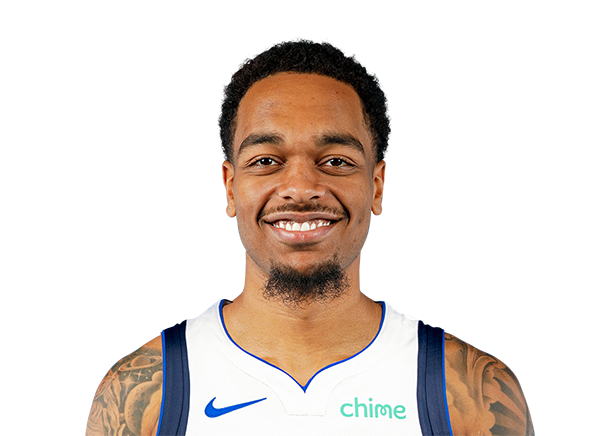
P.J. WashingtonPF
13.6

Naji MarshallSF
11.5
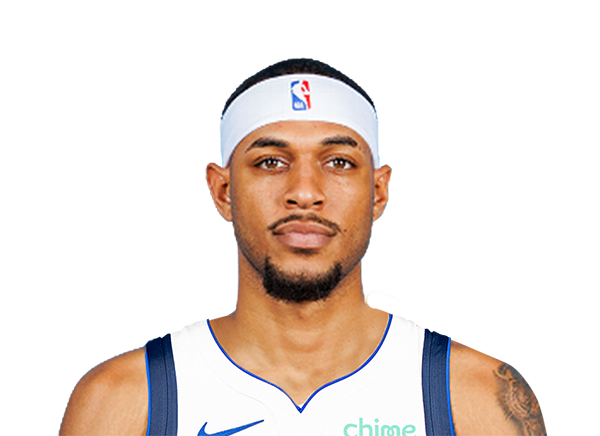
Daniel GaffordC
10.1
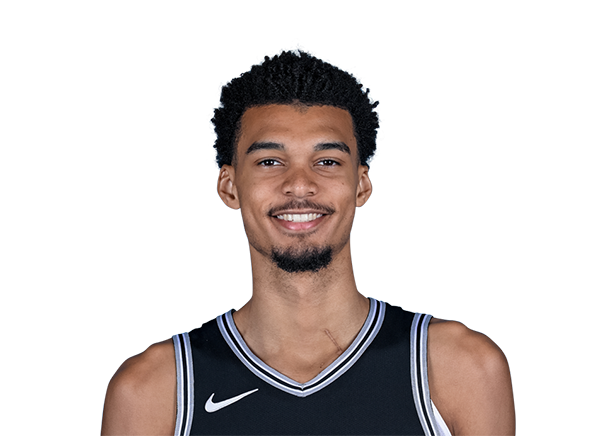
Victor WembanyamaC
25.7
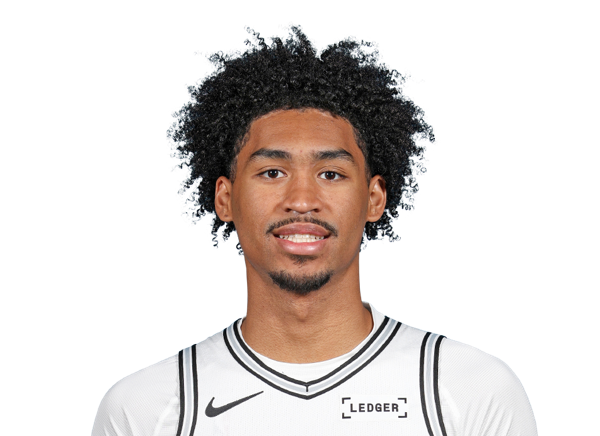
Dylan HarperSG
18.3
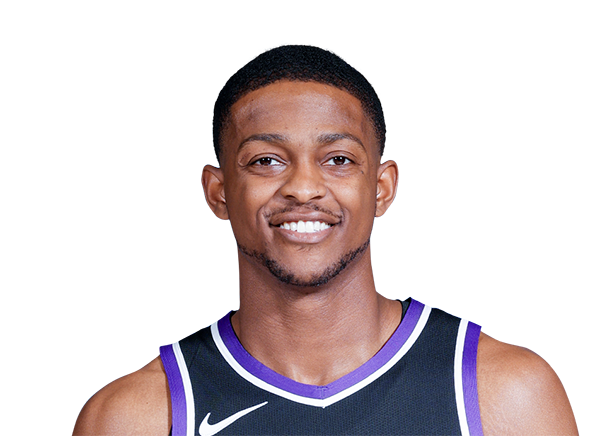
De'Aaron FoxPG
15.9
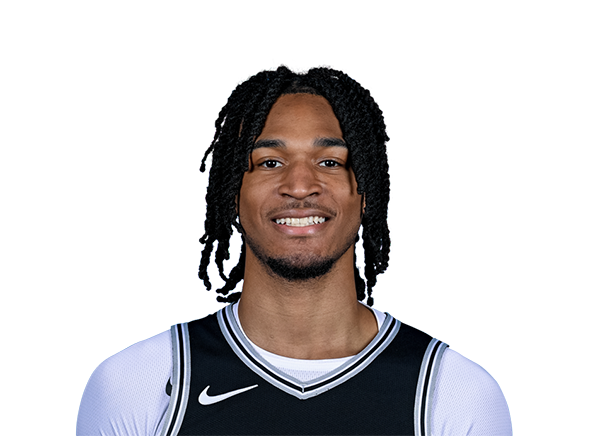
Stephon CastleSG
14.7
Devin VassellSG
11.9
Team Grades
Both teams' own season-to-date production, ranked against the rest of the league -- Core Four, Four Factors, and Net Efficiency, computed from real box scores (regular season only).
PacePaceAn estimate of the number of possessions per 48 minutes by a team.
eFG%Effective Field Goal Percentage(FG + 0.5 x 3P) / FGA. Weights a made 3 as worth 1.5 made 2s, since it's worth one more point.
TOV%Turnover PercentageEstimated turnovers per 100 plays.
OREB%Offensive Rebound PercentageEstimated percentage of available offensive rebounds grabbed.
FT RateFree Throw Attempt RateFTA / FGA -- how often a team gets to the line relative to its field goal attempts.
Off RatingOffensive RatingPoints produced per 100 possessions (Dean Oliver method), team-pace-adjusted.
Def RatingDefensive RatingPoints allowed per 100 possessions (Dean Oliver method), team-pace-adjusted.
Net RatingNet RatingOffensive Rating minus Defensive Rating -- point differential per 100 possessions, the single best metric for evaluating a team's true strength.
Efficiency and Scoring per 100 possessions
Season-to-date shooting, rebounding, and ballhandling per 100 possessions.
"Team" is each team's own production. "Opponent" is what they allowed their opponent to average. Both ranked against all 30 teams.
46.96%10th/30
FG%Field Goal PercentageField Goals made / Field Goal Attempts.
45.50%16th/30
12.6218th/30
3P3-Point Field GoalsPer 100 possessions.
11.5024th/30
37.4717th/30
3PA3-Point Field Goal AttemptsPer 100 possessions.
35.7422nd/30
33.67%19th/30
3P%3-Point Field Goal Percentage3-Point Field Goals made / 3-Point Field Goal Attempts.
32.17%24th/30
29.707th/30
2P2-Point Field GoalsPer 100 possessions.
30.864th/30
52.649th/30
2PA2-Point Field Goal AttemptsPer 100 possessions.
57.362nd/30
56.42%7th/30
2P%2-Point Field Goal Percentage2-Point Field Goals made / 2-Point Field Goal Attempts.
53.81%15th/30
17.0826th/30
FTFree ThrowsPer 100 possessions.
20.6212th/30
22.1827th/30
FTAFree Throw AttemptsPer 100 possessions.
25.7415th/30
77.01%16th/30
FT%Free Throw PercentageFree Throws made / Free Throw Attempts.
80.10%10th/30
12.1117th/30
ORBOffensive ReboundsPer 100 possessions.
13.1211th/30
32.1217th/30
DRBDefensive ReboundsPer 100 possessions.
35.364th/30
8.7914th/30
STLStealsPer 100 possessions.
8.3716th/30
5.869th/30
BLKBlocksPer 100 possessions.
7.371st/30
15.1715th/30
TOVTurnoversPer 100 possessions.
12.623rd/30
22.9419th/30
PFPersonal FoulsPer 100 possessions.
20.494th/30
45.40%15th/30
FG%Field Goal PercentageField Goals made / Field Goal Attempts.
43.21%3rd/30
11.092nd/30
3P3-Point Field GoalsPer 100 possessions.
12.259th/30
37.0915th/30
3PA3-Point Field Goal AttemptsPer 100 possessions.
32.992nd/30
29.90%1st/30
3P%3-Point Field Goal Percentage3-Point Field Goals made / 3-Point Field Goal Attempts.
37.12%26th/30
31.1030th/30
2P2-Point Field GoalsPer 100 possessions.
27.4916th/30
55.8329th/30
2PA2-Point Field Goal AttemptsPer 100 possessions.
58.9830th/30
55.71%24th/30
2P%2-Point Field Goal Percentage2-Point Field Goals made / 2-Point Field Goal Attempts.
46.61%1st/30
18.9915th/30
FTFree ThrowsPer 100 possessions.
16.876th/30
26.0019th/30
FTAFree Throw AttemptsPer 100 possessions.
20.622nd/30
73.04%4th/30
FT%Free Throw PercentageFree Throws made / Free Throw Attempts.
81.82%27th/30
15.1729th/30
ORBOffensive ReboundsPer 100 possessions.
12.3716th/30
31.108th/30
DRBDefensive ReboundsPer 100 possessions.
33.2421st/30
8.7917th/30
STLStealsPer 100 possessions.
7.375th/30
5.2318th/30
BLKBlocksPer 100 possessions.
5.2520th/30
14.2819th/30
TOVTurnoversPer 100 possessions.
13.6226th/30
19.763rd/30
PFPersonal FoulsPer 100 possessions.
21.379th/30
 DAL111