Total Score — Over / Under
Combined score across 100,000 simulated versions of this game, against six fixed lines (no market total posted for this game yet -- the highlighted line is this model's own pick, not a sportsbook number). The real combined score was 236.
O/U LINE 210
92% over ✓8% under
O/U LINE 220
80% over ✓20% under
O/U LINE 230
63% over ✓37% under
O/U LINE 240 MODEL'S PICK
42% over58% under ✓
O/U LINE 250
24% over76% under ✓
O/U LINE 260
11% over89% under ✓
Starter Grades
Season-to-date Basketball-Reference stats for each team's starters, minimum 25% of that team's games started.
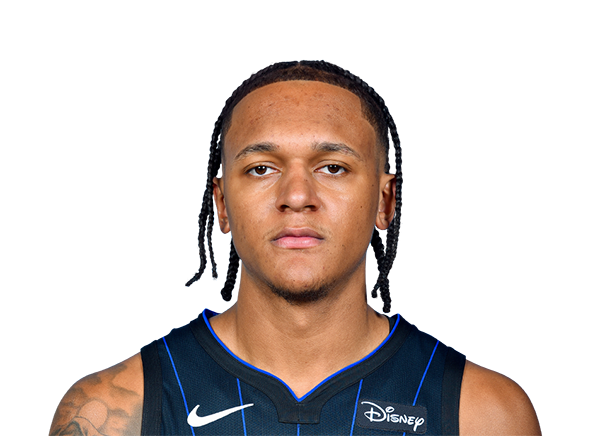
Paolo BancheroPF
22.2

Franz WagnerSF
20.6
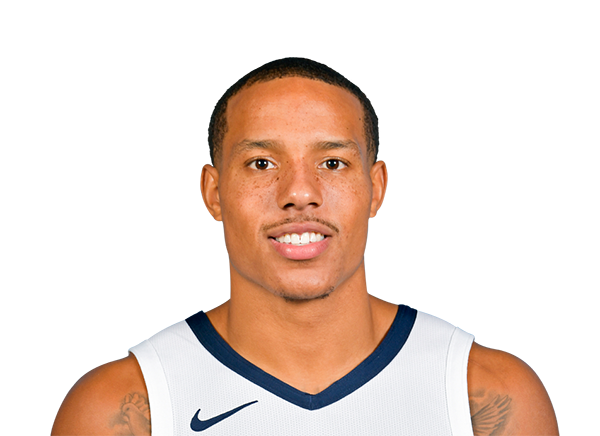
Desmond BaneSG
20.1
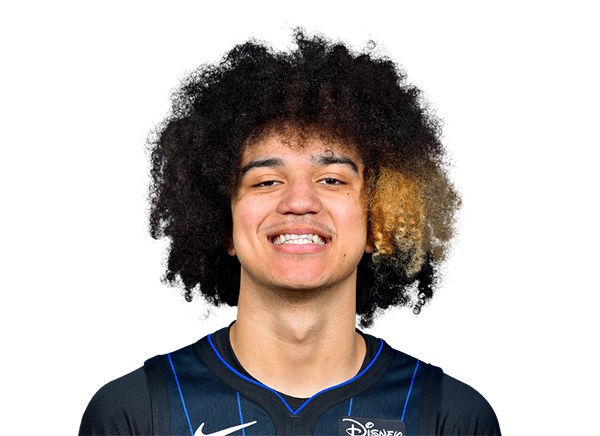
Anthony BlackPG
15.0
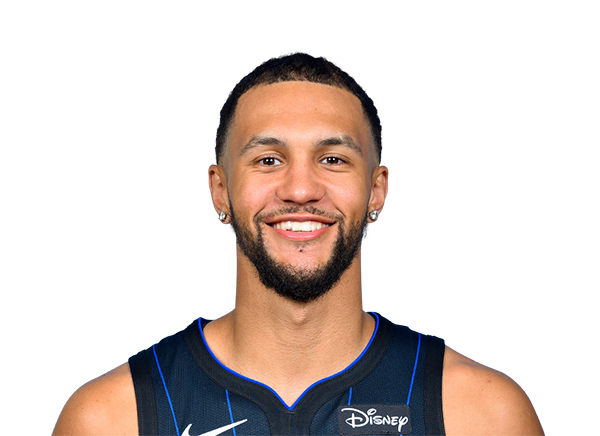
Jalen SuggsPG
13.8
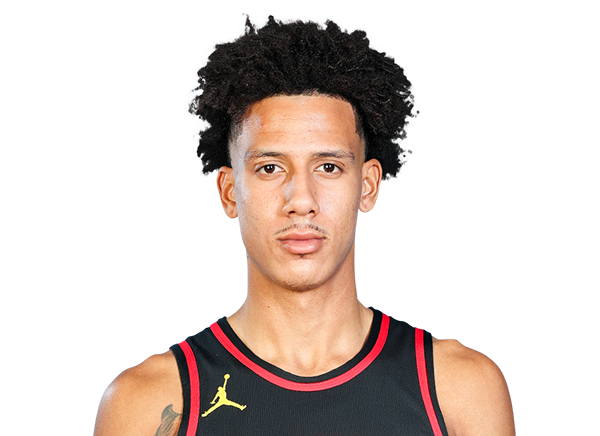
Jalen JohnsonSF
22.5
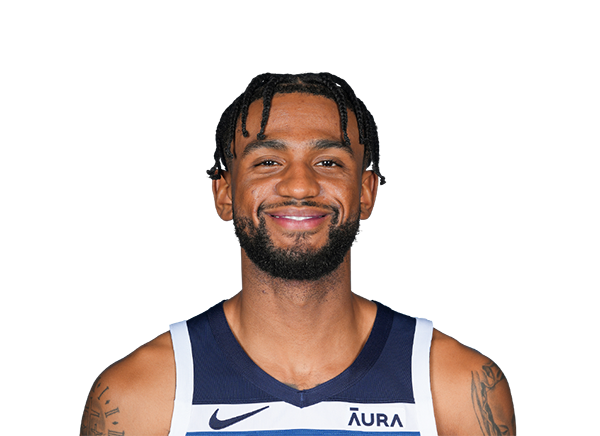
Nickeil Alexander-WalkerSG
20.8
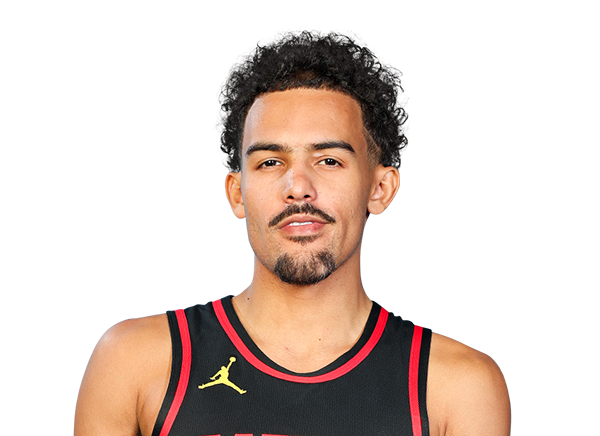
Trae YoungPG
19.3
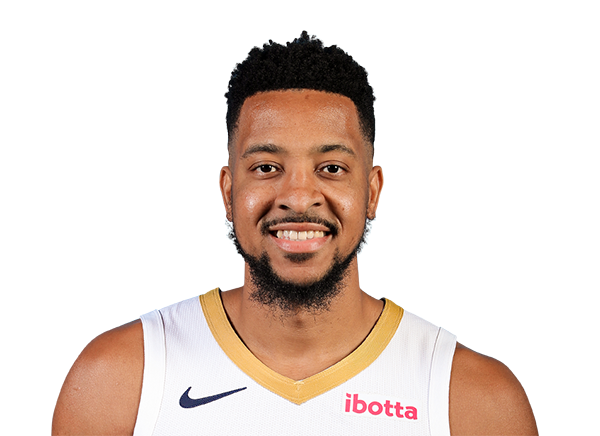
CJ McCollumPG
18.7

Kristaps PorziņģisC
17.1
Team Grades
Both teams' own season-to-date production, ranked against the rest of the league -- Core Four, Four Factors, and Net Efficiency, computed from real box scores (regular season only).
PacePaceAn estimate of the number of possessions per 48 minutes by a team.
eFG%Effective Field Goal Percentage(FG + 0.5 x 3P) / FGA. Weights a made 3 as worth 1.5 made 2s, since it's worth one more point.
TOV%Turnover PercentageEstimated turnovers per 100 plays.
OREB%Offensive Rebound PercentageEstimated percentage of available offensive rebounds grabbed.
FT RateFree Throw Attempt RateFTA / FGA -- how often a team gets to the line relative to its field goal attempts.
Off RatingOffensive RatingPoints produced per 100 possessions (Dean Oliver method), team-pace-adjusted.
Def RatingDefensive RatingPoints allowed per 100 possessions (Dean Oliver method), team-pace-adjusted.
Net RatingNet RatingOffensive Rating minus Defensive Rating -- point differential per 100 possessions, the single best metric for evaluating a team's true strength.
Efficiency and Scoring per 100 possessions
Season-to-date shooting, rebounding, and ballhandling per 100 possessions.
"Team" is each team's own production. "Opponent" is what they allowed their opponent to average. Both ranked against all 30 teams.
46.45%20th/30
FG%Field Goal PercentageField Goals made / Field Goal Attempts.
47.17%13th/30
11.7524th/30
3P3-Point Field GoalsPer 100 possessions.
14.2210th/30
34.0324th/30
3PA3-Point Field Goal AttemptsPer 100 possessions.
38.6011th/30
34.52%25th/30
3P%3-Point Field Goal Percentage3-Point Field Goals made / 3-Point Field Goal Attempts.
36.84%6th/30
29.469th/30
2P2-Point Field GoalsPer 100 possessions.
28.4919th/30
54.688th/30
2PA2-Point Field Goal AttemptsPer 100 possessions.
51.9414th/30
53.87%18th/30
2P%2-Point Field Goal Percentage2-Point Field Goals made / 2-Point Field Goal Attempts.
54.85%16th/30
21.622nd/30
FTFree ThrowsPer 100 possessions.
16.6325th/30
27.081st/30
FTAFree Throw AttemptsPer 100 possessions.
21.5124th/30
79.86%8th/30
FT%Free Throw PercentageFree Throws made / Free Throw Attempts.
77.33%21st/30
10.9821st/30
ORBOffensive ReboundsPer 100 possessions.
10.6422nd/30
32.8513th/30
DRBDefensive ReboundsPer 100 possessions.
32.3317th/30
8.6214th/30
STLStealsPer 100 possessions.
9.237th/30
5.0214th/30
BLKBlocksPer 100 possessions.
4.6020th/30
13.249th/30
TOVTurnoversPer 100 possessions.
13.227th/30
20.8621st/30
PFPersonal FoulsPer 100 possessions.
19.399th/30
47.36%22nd/30
FG%Field Goal PercentageField Goals made / Field Goal Attempts.
47.28%18th/30
11.792nd/30
3P3-Point Field GoalsPer 100 possessions.
12.9211th/30
33.772nd/30
3PA3-Point Field Goal AttemptsPer 100 possessions.
36.329th/30
34.91%6th/30
3P%3-Point Field Goal Percentage3-Point Field Goals made / 3-Point Field Goal Attempts.
35.56%13th/30
29.8323rd/30
2P2-Point Field GoalsPer 100 possessions.
29.0116th/30
54.1122nd/30
2PA2-Point Field Goal AttemptsPer 100 possessions.
52.3614th/30
55.12%17th/30
2P%2-Point Field Goal Percentage2-Point Field Goals made / 2-Point Field Goal Attempts.
55.40%18th/30
19.3222nd/30
FTFree ThrowsPer 100 possessions.
18.2614th/30
24.9423rd/30
FTAFree Throw AttemptsPer 100 possessions.
23.0311th/30
77.47%6th/30
FT%Free Throw PercentageFree Throws made / Free Throw Attempts.
79.27%24th/30
10.734th/30
ORBOffensive ReboundsPer 100 possessions.
11.169th/30
33.0918th/30
DRBDefensive ReboundsPer 100 possessions.
34.1027th/30
7.897th/30
STLStealsPer 100 possessions.
8.4514th/30
5.5026th/30
BLKBlocksPer 100 possessions.
4.8917th/30
14.2113th/30
TOVTurnoversPer 100 possessions.
14.749th/30
21.5827th/30
PFPersonal FoulsPer 100 possessions.
18.374th/30
 ORL112