 POR104
FINAL
98HOU
Portland Trail Blazers vs Houston Rockets — Win Probability
FINAL
Portland Trail Blazers
6-10
104
VS
Houston Rockets
12-5
98
Injury Report
Live ESPN injury status for both teams, polled fresh each run.
POR
- Ja MorantOut
- Vit KrejciOut
- Shaedon SharpeOut
HOU
- Oscar TshiebweDay-To-Day
- Clint CapelaOut
- Steven AdamsOut
Prediction vs. Result
We keep every prediction permanently so we can always show our work.
PREGAME WIN PROBABILITY
Rockets 88%
ACTUAL RESULT
Blazers won by 6
COMBINED SCORE
202
Margin of Victory — Houston Rockets (Home)
Pregame odds for every possible outcome, simulated before tipoff -- the highlighted bar is what actually happened.
Lost ← actual result
15%
Won by 1-3
6%
Won by 4-7
9%
Won by 8-14
19%
Won by 15-21
19%
Won by 21+
32%
Total Score — Over / Under
Combined score across 100,000 simulated versions of this game, against six fixed lines (no market total posted for this game yet -- the highlighted line is this model's own pick, not a sportsbook number). The real combined score was 202.
O/U LINE 210
75% over25% under ✓
O/U LINE 220 MODEL'S PICK
56% over44% under ✓
O/U LINE 230
35% over65% under ✓
O/U LINE 240
18% over82% under ✓
O/U LINE 250
8% over92% under ✓
O/U LINE 260
3% over97% under ✓
Starter Grades
Season-to-date Basketball-Reference stats for each team's starters, minimum 25% of that team's games started.
POR
Points Per GamePoints scored per game.
Player Efficiency RatingPlayer Efficiency Rating (John Hollinger) -- a per-minute rating summing a player's positive contributions and subtracting the negative, league-adjusted so 15.0 = average.
Win Shares Per 48 MinutesAn estimate of the number of wins contributed by a player per 48 minutes (league average is approximately .100).
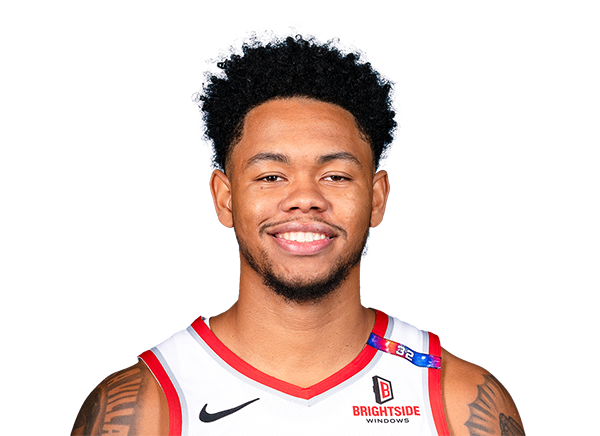
Anfernee SimonsSG
19.3
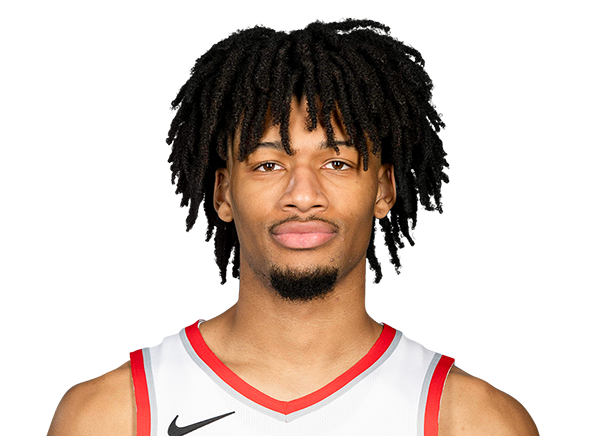
Shaedon SharpeSG
18.5

Deni AvdijaSF
16.9
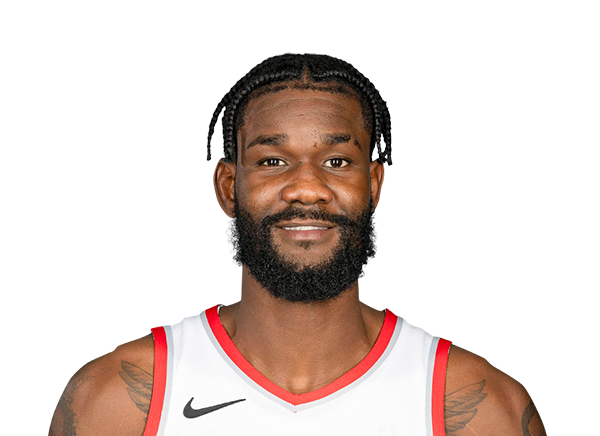
Deandre AytonC
14.4

Jerami GrantPF
14.4
HOU
Points Per GamePoints scored per game.
Player Efficiency RatingPlayer Efficiency Rating (John Hollinger) -- a per-minute rating summing a player's positive contributions and subtracting the negative, league-adjusted so 15.0 = average.
Win Shares Per 48 MinutesAn estimate of the number of wins contributed by a player per 48 minutes (league average is approximately .100).
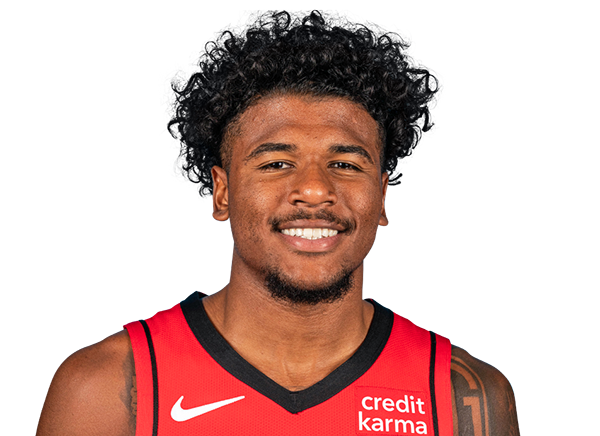
Jalen GreenSG
21.0
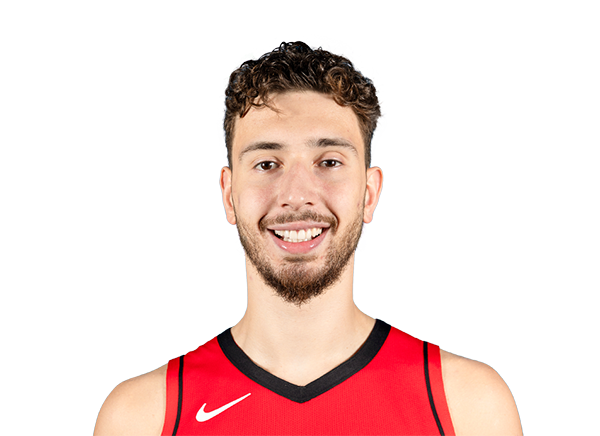
Alperen ŞengünC
19.1

Amen ThompsonSF
14.1
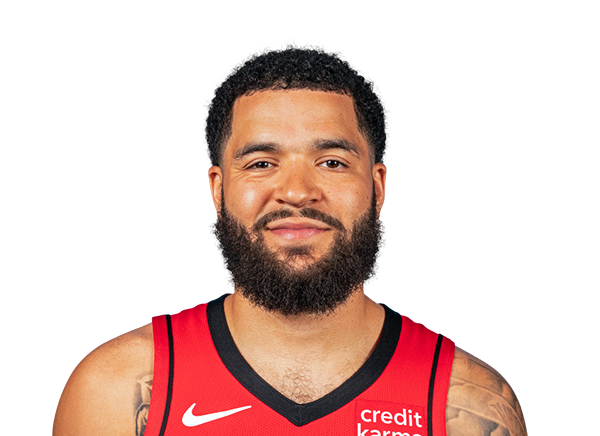
Fred VanVleetPG
14.1

Dillon BrooksSF
14.0
Follow Us