 PHX104
FINAL
127SAC
Phoenix Suns vs Sacramento Kings — Win Probability
FINAL
Phoenix Suns
9-2
104
VS
Sacramento Kings
6-5
127
Injury Report
Live ESPN injury status for both teams, polled fresh each run.
PHX
- Jordan GoodwinOut
- Mark WilliamsOut
SAC
- Maxime RaynaudOut
- Keegan MurrayDay-To-Day
- Domantas SabonisDay-To-Day
- Ben SimmonsOut
Prediction vs. Result
We keep every prediction permanently so we can always show our work.
PREGAME WIN PROBABILITY
Kings 53%
ACTUAL RESULT
Kings won by 23
COMBINED SCORE
231
Margin of Victory — Sacramento Kings (Home)
Pregame odds for every possible outcome, simulated before tipoff -- the highlighted bar is what actually happened.
Lost
45%
Won by 1-3
9%
Won by 4-7
11%
Won by 8-14
16%
Won by 15-21
11%
Won by 21+ ← actual result
9%
Total Score — Over / Under
Combined score across 100,000 simulated versions of this game, against six fixed lines (no market total posted for this game yet -- the highlighted line is this model's own pick, not a sportsbook number). The real combined score was 231.
O/U LINE 210
85% over ✓15% under
O/U LINE 220
70% over ✓30% under
O/U LINE 230 MODEL'S PICK
50% over ✓50% under
O/U LINE 240
30% over70% under ✓
O/U LINE 250
15% over85% under ✓
O/U LINE 260
6% over94% under ✓
Starter Grades
Season-to-date Basketball-Reference stats for each team's starters, minimum 25% of that team's games started.
PHX
Points Per GamePoints scored per game.
Player Efficiency RatingPlayer Efficiency Rating (John Hollinger) -- a per-minute rating summing a player's positive contributions and subtracting the negative, league-adjusted so 15.0 = average.
Win Shares Per 48 MinutesAn estimate of the number of wins contributed by a player per 48 minutes (league average is approximately .100).

Kevin DurantPF
26.6
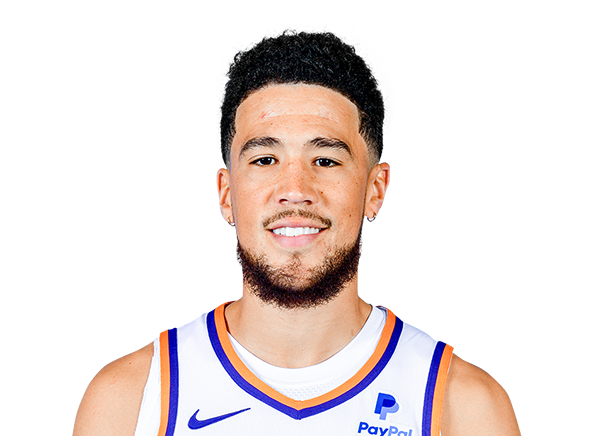
Devin BookerSG
25.6

Bradley BealSG
17.0
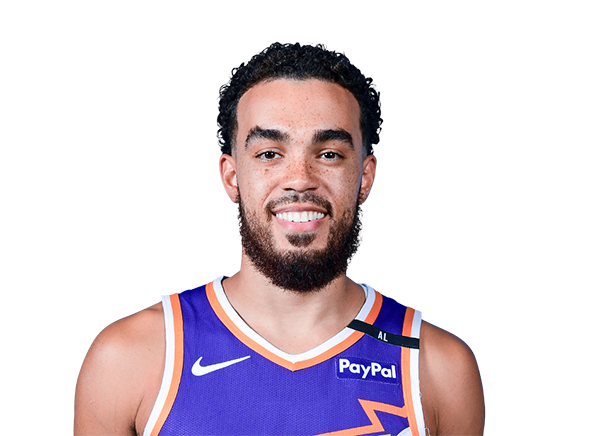
Tyus JonesPG
10.2
Nick RichardsC
9.5
SAC
Points Per GamePoints scored per game.
Player Efficiency RatingPlayer Efficiency Rating (John Hollinger) -- a per-minute rating summing a player's positive contributions and subtracting the negative, league-adjusted so 15.0 = average.
Win Shares Per 48 MinutesAn estimate of the number of wins contributed by a player per 48 minutes (league average is approximately .100).

De'Aaron FoxPG
25.0

Zach LaVineSG
22.4
DeMar DeRozanSF
22.2

Domantas SabonisC
19.1

Malik MonkSG
17.2
Follow Us