SF58%▲
Sun 1:00 PM ET
42%ATL
← back to predictions

San Francisco 49ers vs Atlanta Falcons — Win Probability

Sun 1:00 PM ET

San Francisco 49ers logo
San Francisco 49ers
6-0
58%
VS
Atlanta Falcons logo
Atlanta Falcons
2-4
42%
Market line: SF -2.5, total 49.5 · Model expected score: San Francisco 49ers 26.0 – Atlanta Falcons 23.5
Ad space

Injury Report

The latest official designations and practice participation for both teams.

SF
  • WRDeebo Samuel Sr.DNP
  • LBGarret WallowDNP
  • LBLuke GiffordDNP
  • SMarques SigleDNP
  • WRMike EvansDNP
  • DEMykel WilliamsDNP
  • DENick BosaDNP
  • SSiran NealDNP
  • CBUpton StoutDNP
  • SAshtyn DavisLimited
  • LBJaden DuggerLimited
  • WRChristian KirkFull
  • DERomello HeightFull
ATL
  • CBBilly Bowman Jr.DNP
  • LBDivine DeabloDNP
  • CBA.J. TerrellLimited
  • CBAvieon TerrellLimited
  • WRBeaux CollinsLimited
  • RBBrian RobinsonLimited
  • CBC.J. HendersonLimited
  • TMichael JerrellLimited
  • WROlamide ZaccheausLimited
  • DESamson EbukamLimited
  • DEZa'Darius SmithLimited
  • LBKendal DanielsFull
Ad space

Margin of Victory — Atlanta Falcons (Home)

How often each outcome happened for Atlanta Falcons, across every simulated version of this game.

Lost / Tied
58%
Won by 1-3
9%
Won by 4-7
10%
Won by 8-14
13%
Won by 15-21
7%
Won by 21+
4%

Total Score — Over / Under

Combined final score against five common lines, plus this game's actual market line.

O/U LINE 30
93% over7% under
O/U LINE 40
76% over24% under
O/U LINE 44
66% over34% under
O/U LINE 48
55% over45% under
O/U LINE 49.5 MARKET LINE
50% over50% under
O/U LINE 52
43% over57% under
🔒

Unlock Full Game Stats

Margin-of-victory breakdowns and total-score probabilities for every game are a free-account feature. This one's part of the paid slate — the Game of the Week is always free to view in full.

Sign Up Free
Every number above comes from the model's live prediction data — 100,000 Monte Carlo simulations, grounded in the market line at generation time.

Ad space

Highest Graded Players

Season-to-date PFF grades for each team's top graded players, minimum 25% of that side's snaps.

SF
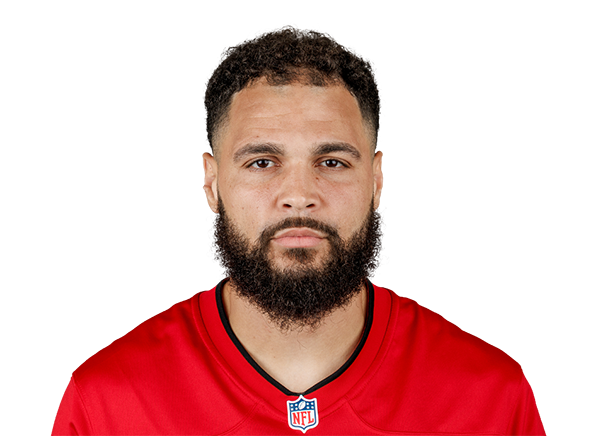
Mike EvansWR
92.3
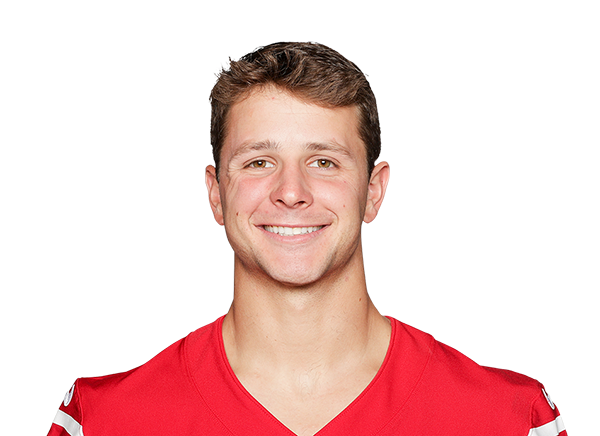
Brock PurdyQB
88.5
Trent WilliamsT
83.8
Colton McKivitzT
75.4
George KittleTE
74.2
ATL
Bijan RobinsonHB
90.2
Drake LondonWR
89.7
Chris LindstromG
83.4
Brian RobinsonHB
74.6
Matthew BergeronG
69.3

QB Matchup

Each team's real current starting QB (per PFF's own depth chart) -- season-to-date PFF grades and passing profile, ranked against the league's other starters. A stat reads “—” when that player has no recorded snaps for it yet this season (e.g. just back from injury).

SFBrock Purdy
VS
ATLMichael Penix Jr.
SF
88.5
2nd / 35
Overall Grade
ATL
64.8
24th / 35
SF
81.2
18th / 35
Clean Pocket Grade
ATL
89.1
7th / 35
SF
75.3
1st / 35
Pressure Grade
ATL
28.5
33rd / 35
SF
4.7%
8th / 35
Big Time Throw %
ATL
5.0%
6th / 35
SF
2.4%
13th / 35
Turnover Worthy %
ATL
5.3%
30th / 35
SF
3.07s
23rd / 35
Avg Time To Throw
ATL
2.57s
4th / 35
SF
8.2
19th / 35
Avg Depth of Target
ATL
8.3
18th / 35

Efficiency and Scoring

Season-to-date EPA, success rate, and scoring, with each figure's league rank.

Offense
SFATL
+0.202nd/32
EPA / Play
-0.0421st/32
+0.391st/32
EPA / Play (Passing)
-0.1529th/32
-0.0516th/32
EPA / Play (Rushing)
+0.082nd/32
53.2%1st/32
Success Rate
44.7%17th/32
60.1%1st/32
Success Rate (Passing)
43.5%24th/32
44.4%11th/32
Success Rate (Rushing)
46.2%5th/32
30.83rd/32
Points Per Game
23.813th/32
Defense
SFATL
-0.067th/32
EPA / Play
-0.0119th/32
-0.038th/32
EPA / Play (Passing)
+0.0319th/32
-0.0911th/32
EPA / Play (Rushing)
-0.0912th/32
44.5%17th/32
Success Rate
43.3%10th/32
44.0%6th/32
Success Rate (Passing)
44.6%9th/32
45.2%29th/32
Success Rate (Rushing)
40.6%14th/32
18.63rd/32
Points Per Game
24.421st/32

Pressure Matchup

Each team's O-line pressure allowed against the other team's pass rush generated.

When San Francisco 49ers have the ball
SF pressure allowed32.1%7th of 32
→
ATL pressure generated44.0%3rd of 32
When Atlanta Falcons have the ball
ATL pressure allowed31.4%4th of 32
→
SF pressure generated36.6%18th of 32

Team Grades

Both teams' own season-to-date PFF grades, side by side.

Grades ranked all 32 teams
SF
80.3
5th / 32
Overall
ATL
80.0
6th / 32
SF
75.8
7th / 32
Offense
ATL
71.9
15th / 32
SF
67.9
13th / 32
Defense
ATL
71.7
7th / 32
SF
86.9
11th / 32
Special Teams
ATL
90.3
5th / 32
SF
71.9
13th / 32
Passing Offense
ATL
53.6
28th / 32
SF
80.0
7th / 32
Rushing Offense
ATL
83.1
4th / 32
SF
73.4
13th / 32
Receiving
ATL
76.7
8th / 32
SF
70.2
5th / 32
Offensive Line
ATL
62.8
19th / 32
SF
67.7
23rd / 32
Pass Rush
ATL
80.2
3rd / 32
SF
71.1
8th / 32
Coverage
ATL
68.7
11th / 32
SF
60.7
18th / 32
Run Defense
ATL
61.2
16th / 32
🔒

Unlock Matchups & Betting Edge

PFF player grades, lineup matchups, and betting-line insights for every game are a free-account feature. This one's part of the paid slate — the Game of the Week is always free to view in full.

Sign Up Free