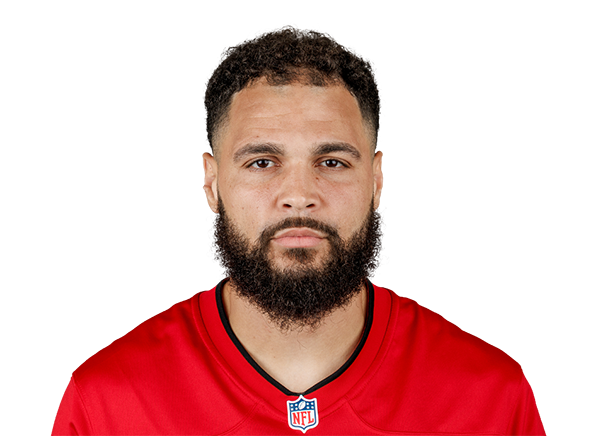
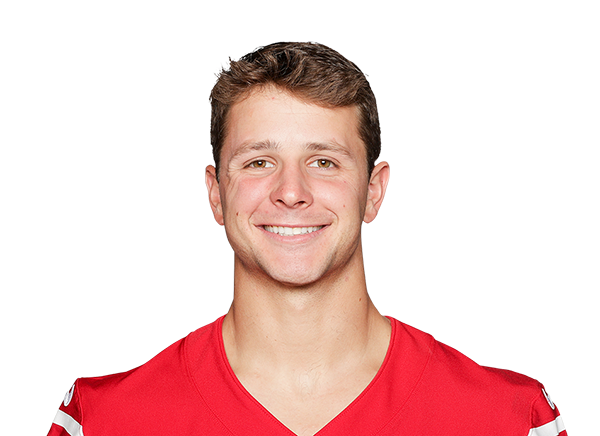
Washington Commanders vs San Francisco 49ers — Win Probability


Injury Report
The latest official designations and practice participation for both teams.
- QBMarcus MariotaOut
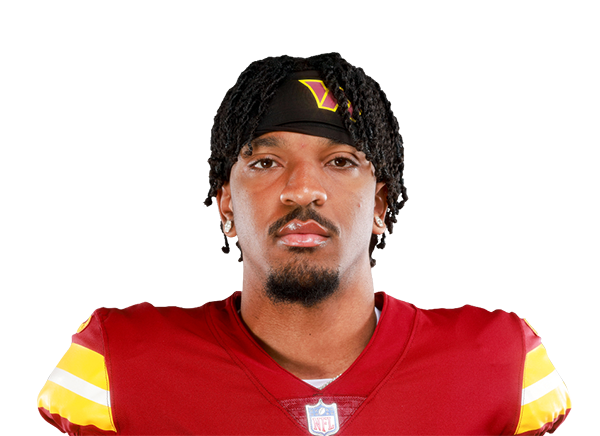
- QBJayden DanielsFull
- DECharles OmenihuOut
- RBJacory Croskey-MerrittOut
- LBJavontae Jean-BaptisteOut
- DTJavon KinlawQuestionable
- RBJeremy McNicholsQuestionable
- LBJordan MageeQuestionable
- GLucas PatrickQuestionable
- SNick CrossQuestionable
- SPercy ButlerQuestionable
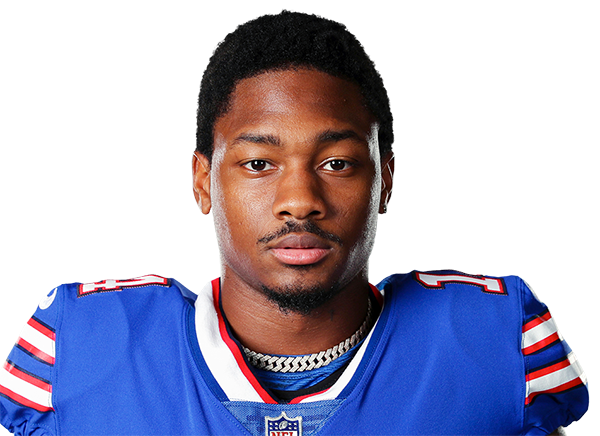
- WRStefon DiggsQuestionable
- CBTrey AmosQuestionable
- STyler OwensQuestionable
- RBAustin EkelerLimited
- CBFabian MoreauLimited
- SJeremy ReavesLimited
- RBRachaad WhiteLimited
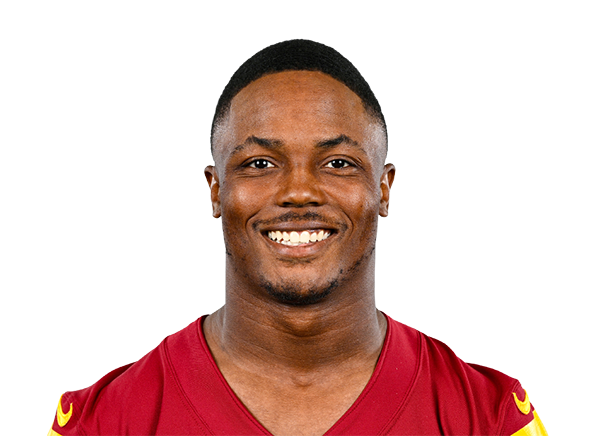
- WRTerry McLaurinLimited
- WRTreylon BurksLimited
- LBK'Lavon ChaissonFull
- SQuan MartinFull
- WRDeebo Samuel Sr.Out
- LBGarret WallowOut
- SMarques SigleOut
- DENick BosaOut
- WRChristian KirkQuestionable
- DTGracen HaltonQuestionable
- WRMike EvansQuestionable
- DEMykel WilliamsQuestionable
- SSiran NealQuestionable
- CBUpton StoutQuestionable
- DERomello HeightLimited
- GCarver WillisFull
- TColton McKivitzFull
- WRJacob CowingFull
- DTJames Thompson Jr.Full
- FBKyle JuszczykFull
Prediction vs. Result
We keep every prediction permanently so we can always show our work.
49ers' 6-point win falls short of model projection in narrow miss
San Francisco's 23-17 victory over Washington played out as the expected result but with notably less margin than the model anticipated. The 49ers entered as 70% favorites with an expected score of 29.2-22.3, giving them a projected 7-point win. The market priced the spread at 7 points—aligned with that simulation.
What actually happened: San Francisco won, but by 6 points instead of 7. The final score of 23-17 represents a 1-point undershoot of the model's expected margin, placing this squarely in the category of near-call accuracy.
The 49ers scored 4.2 points fewer than projected (29.2 down to 23), while Washington performed closer to expectation, allowing 5.3 points more than the model forecasted (22.3 up to 17). The gap between projection and result was minimal—less than a full possession—which reflects normal game-to-game variance rather than a fundamental misread of matchup dynamics.
The model correctly identified San Francisco as the stronger team and the likely winner. The 70% win probability proved validated, as did the overall directional forecast. The spread of 7 points versus the actual 6-point margin sits well within acceptable bounds for pregame modeling; a single-possession difference on a 50-minute game represents the kind of noise inherent to football predictions.
This outcome demonstrates the model's ability to set appropriate favorites and identify likely winners without requiring perfect score projections. San Francisco's 6-0 start reflects the consistency embedded in that 70% pregame assessment. Washington's 1-4-1 record aligns with the lower win probability assigned before this game. The model neither overestimated nor underestimated the margin by any significant measure.
Margin of Victory — San Francisco 49ers (Home)
Pregame odds for every possible outcome, simulated before kickoff -- the highlighted bar is what actually happened.
Total Score — Over / Under
Combined final score against five common lines, plus this game's actual market line -- the real combined score was 40.
Unlock Full Game Stats
Margin-of-victory breakdowns and total-score probabilities for every game are a free-account feature. This one's part of the paid slate — the Game of the Week is always free to view in full.
Sign Up Free