NO34
FINAL
27NYG
← back to predictions

New Orleans Saints vs New York Giants — Win Probability


FINAL
New Orleans Saints logo
New Orleans Saints
1-4
34
VS
New York Giants logo
New York Giants
3-1-1
27
Market line: NO -1.0, total 46.5 · Model expected score: New Orleans Saints 23.7 – New York Giants 22.8
Ad space

Injury Report

The latest official designations and practice participation for both teams.

NO
  • QBTyler ShoughFull
  • LBAnfernee JenningsOut
  • LBKaden EllissOut
  • RBAlvin KamaraQuestionable
  • WRChris OlaveQuestionable
  • CBLorenzo Styles Jr.Questionable
  • DTNathan ShepherdQuestionable
  • LSZach WoodQuestionable
  • DTColby WoodenFull
  • GJeremiah WrightFull
  • LBTyree WilsonFull
  • DTVernon BroughtonFull
NYG
  • CBColton HoodOut
  • TETheo JohnsonOut
  • STyler NubinOut
  • LBAbdul CarterQuestionable
  • TAndrew ThomasQuestionable
  • TJermaine EluemunorQuestionable
  • CBGreg Newsome IILimited
  • WRCharlie JonesFull
  • WRDarnell MooneyFull
  • SElijah CampbellFull
  • TEIsaiah LikelyFull
  • SJason PinnockFull
  • LBMalik HarrisonFull
  • RBNajee HarrisFull

Prediction vs. Result

We keep every prediction permanently so we can always show our work.

PREGAME WIN PROBABILITY
Saints 53%
ACTUAL RESULT
New Orleans Saints won by 7
COMBINED SCORE
61

Saints Edge Giants in Close Contest; Model Underestimated New Orleans

New Orleans won 34–27 over New York, a 7-point margin that exceeded the model's pregame projection by more than 6 points. The Saints were favored by 1 in the market and carried a 53% win probability in the model's simulation, suggesting a nearly even matchup with a slight lean to New Orleans.

The model's expected final score was 23.7–22.8 in New Orleans' favor—a razor-thin 0.9-point margin. In reality, the Saints won comfortably by 7, indicating the model significantly underestimated the gap between the teams. New Orleans scored 10 more points than projected (34 vs. 23.7), while the Giants exceeded their projection by 4 (27 vs. 22.8). This was not a defensive slugfest or a defensive explosion; both teams outperformed their expected offensive output, but New Orleans by a wider margin.

The market and model aligned closely in identifying New Orleans as the slight favorite—the 1-point spread versus the 0.9-point expected margin shows consistency in pregame assessment. But neither fully captured the Saints' decisive advantage in execution. A 7-point margin represents a clear win, not a statistical coincidence, and the model's projection fell well short of that outcome.

The Saints improved to 2–4 after the win, while the Giants fell to 3–2–1. This was not an upset—New Orleans was favored—but it was a more decisive victory than the model anticipated. The gap between expected and actual (6.1 points) suggests either that pregame evaluation missed something about relative strength, or that in-game performance diverged from typical expectations. For a model built on averages and historical patterns, this represents a miss worth noting: the Saints were better than projected, the Giants worse, and the aggregate difference was material.

Ad space

Margin of Victory — New York Giants (Home)

Pregame odds for every possible outcome, simulated before kickoff -- the highlighted bar is what actually happened.

Lost / Tied ← actual result
53%
Won by 1-3
9%
Won by 4-7
11%
Won by 8-14
15%
Won by 15-21
8%
Won by 21+
5%

Total Score — Over / Under

Combined final score against five common lines, plus this game's actual market line -- the real combined score was 61.

O/U LINE 30
89% over ✓11% under
O/U LINE 40
69% over ✓31% under
O/U LINE 44
57% over ✓43% under
O/U LINE 46.5 MARKET LINE
50% over ✓50% under
O/U LINE 48
45% over ✓55% under
O/U LINE 52
34% over ✓66% under
🔒

Unlock Full Game Stats

Margin-of-victory breakdowns and total-score probabilities for every game are a free-account feature. This one's part of the paid slate — the Game of the Week is always free to view in full.

Sign Up Free

Every number above comes from the model's live prediction data — 100,000 Monte Carlo simulations, grounded in the market line at generation time.

Ad space

Highest Graded Players

Season-to-date PFF grades for each team's top graded players, minimum 25% of that side's snaps.

NO
Chris OlaveWR
87.1
Erik McCoyC
74.6
Tyler ShoughQB
74.5
Juwan JohnsonTE
71.5
Devaughn VeleWR
71.3
NYG
Malik NabersWR
81.7
Isaiah LikelyTE
80.8
Andrew ThomasT
76.3
Jermaine EluemunorT
72.7
Bryan HudsonC
66.4

QB Matchup

Each team's real current starting QB (per PFF's own depth chart) -- season-to-date PFF grades and passing profile, ranked against the league's other starters. A stat reads “—” when that player has no recorded snaps for it yet this season (e.g. just back from injury).

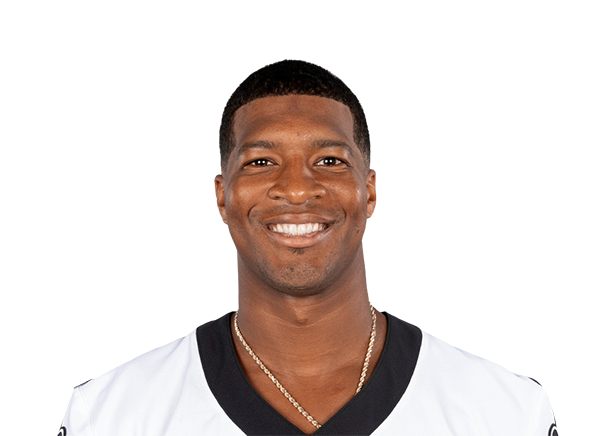
NOTyler Shough
VS
NYGJameis Winston
NO
74.5
14th / 35
Overall Grade
NYG
52.8
30th / 35
NO
86.2
13th / 35
Clean Pocket Grade
NYG
56.4
35th / 35
NO
51.6
11th / 35
Pressure Grade
NYG
43.1
19th / 35
NO
4.0%
17th / 35
Big Time Throw %
NYG
4.2%
11th / 35
NO
1.8%
7th / 35
Turnover Worthy %
NYG
4.2%
22nd / 35
NO
2.72s
10th / 35
Avg Time To Throw
NYG
2.69s
8th / 35
NO
8.2
19th / 35
Avg Depth of Target
NYG
9.1
9th / 35

Efficiency and Scoring

Season-to-date EPA, success rate, and scoring, with each figure's league rank.

Offense
NONYG
-0.0217th/32
EPA / Play
-0.0218th/32
+0.0120th/32
EPA / Play (Passing)
+0.0617th/32
-0.0719th/32
EPA / Play (Rushing)
-0.1526th/32
44.8%16th/32
Success Rate
42.7%21st/32
47.1%17th/32
Success Rate (Passing)
46.3%18th/32
40.7%17th/32
Success Rate (Rushing)
37.3%26th/32
23.616th/32
Points Per Game
21.821st/32
Defense
NONYG
+0.0927th/32
EPA / Play
+0.0321st/32
+0.1022nd/32
EPA / Play (Passing)
+0.0820th/32
+0.0732nd/32
EPA / Play (Rushing)
-0.0421st/32
50.5%32nd/32
Success Rate
46.9%25th/32
52.4%28th/32
Success Rate (Passing)
48.4%22nd/32
47.8%32nd/32
Success Rate (Rushing)
44.9%27th/32
30.231st/32
Points Per Game
21.29th/32

Pressure Matchup

Each team's O-line pressure allowed against the other team's pass rush generated.

When New Orleans Saints have the ball
NO pressure allowed37.7%21st of 32
→
NYG pressure generated25.8%32nd of 32
When New York Giants have the ball
NYG pressure allowed31.7%6th of 32
→
NO pressure generated28.1%30th of 32

Team Grades

Both teams' own season-to-date PFF grades, side by side.

Grades ranked all 32 teams
NO
74.2
17th / 32
Overall
NYG
75.5
13th / 32
NO
71.7
16th / 32
Offense
NYG
68.0
22nd / 32
NO
61.6
24th / 32
Defense
NYG
73.1
3rd / 32
NO
91.3
2nd / 32
Special Teams
NYG
85.1
12th / 32
NO
72.7
11th / 32
Passing Offense
NYG
60.0
22nd / 32
NO
56.2
31st / 32
Rushing Offense
NYG
64.5
26th / 32
NO
76.3
10th / 32
Receiving
NYG
72.3
15th / 32
NO
62.2
21st / 32
Offensive Line
NYG
66.8
10th / 32
NO
67.9
21st / 32
Pass Rush
NYG
67.2
24th / 32
NO
55.3
22nd / 32
Coverage
NYG
77.0
4th / 32
NO
59.0
22nd / 32
Run Defense
NYG
65.3
11th / 32
🔒

Unlock Matchups & Betting Edge

PFF player grades, lineup matchups, and betting-line insights for every game are a free-account feature. This one's part of the paid slate — the Game of the Week is always free to view in full.

Sign Up Free