CAR25
FINAL
14PHI
← back to predictions

Carolina Panthers vs Philadelphia Eagles — Win Probability


FINAL
Carolina Panthers logo
Carolina Panthers
2-2
25
VS
Philadelphia Eagles logo
Philadelphia Eagles
2-3
14
Market line: CAR -3.0, total 39.5 · Model expected score: Carolina Panthers 21.3 – Philadelphia Eagles 18.2
Ad space

Injury Report

The latest official designations and practice participation for both teams.

CAR
  • QBBryce YoungFull
  • RBAJ DillonOut
  • TMonroe FreelingDoubtful
  • GDamien LewisQuestionable
  • LBJaelan PhillipsQuestionable
  • TTaylor MotonQuestionable
  • DTTershawn WhartonQuestionable
  • RBTrevor EtienneQuestionable
  • TEDarren WallerFull
  • WRJalen CokerFull
  • LBThomas IncoomFull
  • TETommy TrembleFull
PHI
  • QBJalen HurtsOut
  • TEEli StowersOut
  • TEGrant CalcaterraOut
  • CBJakorian BennettOut
  • LBJalyx HuntOut
  • GLandon DickersonOut
  • SMichael Carter IIOut
  • RBSaquon BarkleyOut
  • RBWill ShipleyOut
  • LBA.J. EpenesaDoubtful
  • CDrew KendallQuestionable
  • SAndrew MukubaFull
  • LBArnold EbiketieFull
  • WRDeVonta SmithFull
  • WRDontayvion WicksFull
  • TEE.J. JenkinsFull
  • TFred JohnsonFull
  • DTJalen CarterFull
  • LBJihaad CampbellFull
  • LBJonathan GreenardFull
  • CBMac McWilliamsFull
  • SMarcus EppsFull
  • WRMarquise BrownFull
  • GTyler SteenFull
  • LBZack BaunFull

Prediction vs. Result

We keep every prediction permanently so we can always show our work.

PREGAME WIN PROBABILITY
Panthers 59%
ACTUAL RESULT
Carolina Panthers won by 11
COMBINED SCORE
39

Panthers Beat Eagles by 11, Crushing Model's Tight-Game Projection

Carolina's 25-14 win over Philadelphia on Sunday was not an upset—the Panthers entered as the market favorite with a 59% win probability—but it was a decisive miss for the pregame model's scoring projection.

The model expected a tight contest: Carolina 21.3, Philadelphia 18.2, a margin of just 3 points. The market agreed, setting the spread at 3 points in Carolina's favor. Both aligned on direction. Neither anticipated the gap that actually opened.

Carolina won by 11, scoring 25 and holding Philadelphia to 14. That's an 8-point deviation from the expected margin. The Panthers' actual output (25 points) exceeded the model's projection by 3.7 points. The Eagles came in 4.2 points below forecast at 14.

The result moved Carolina to 3-2 and Philadelphia to 2-4—both outcomes consistent with a clear home-field performance by the favorite, but the margin size suggested the model underestimated the efficiency gap between these teams on Sunday.

This was not a close miss. A 3-point spread typically reflects high uncertainty; an 11-point final margin sits well outside the distribution the model was assigning pregame. The Panthers didn't just win as expected—they dominated a Philadelphia team that failed to execute at the level the projection assumed.

For a model that won the directional call and assigned proper favorite status, the magnitude miss is notable. Carolina's 59% win probability was conservative relative to how the game actually played out. The Eagles' collapse from 18.2 expected points to 14 actual points was the larger contributor to the gap, suggesting Philadelphia's performance fell short of baseline expectations in ways the pregame forecast did not fully capture.

Ad space

Margin of Victory — Philadelphia Eagles (Home)

Pregame odds for every possible outcome, simulated before kickoff -- the highlighted bar is what actually happened.

Lost / Tied ← actual result
59%
Won by 1-3
8%
Won by 4-7
10%
Won by 8-14
13%
Won by 15-21
7%
Won by 21+
4%

Total Score — Over / Under

Combined final score against five common lines, plus this game's actual market line -- the real combined score was 39.

O/U LINE 30
76% over ✓24% under
O/U LINE 39.5 MARKET LINE
50% over50% under ✓
O/U LINE 40
49% over51% under ✓
O/U LINE 44
37% over63% under ✓
O/U LINE 48
26% over74% under ✓
O/U LINE 52
17% over83% under ✓
🔒

Unlock Full Game Stats

Margin-of-victory breakdowns and total-score probabilities for every game are a free-account feature. This one's part of the paid slate — the Game of the Week is always free to view in full.

Sign Up Free
Every number above comes from the model's live prediction data — 100,000 Monte Carlo simulations, grounded in the market line at generation time.

Ad space

Highest Graded Players

Season-to-date PFF grades for each team's top graded players, minimum 25% of that side's snaps.

CAR
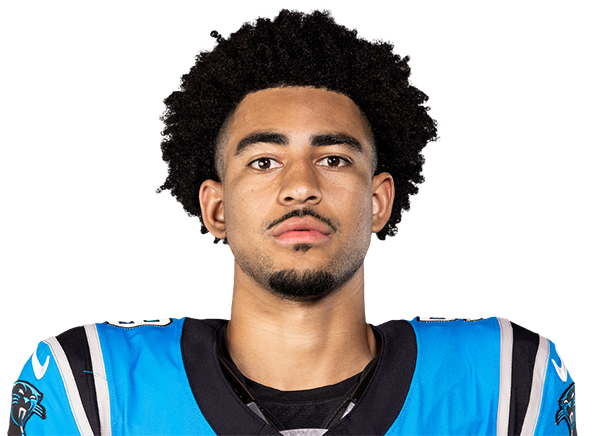
Bryce YoungQB
85.2
Chuba HubbardHB
82.9
Tetairoa McMillanWR
80.4
Damien LewisG
78.1
Jalen CokerWR
75.0
PHI
DeVonta SmithWR
90.5
Jordan MailataT
80.6
Lane JohnsonT
79.8
Dallas GoedertTE
76.2
Dontayvion WicksWR
68.9

QB Matchup

Each team's real current starting QB (per PFF's own depth chart) -- season-to-date PFF grades and passing profile, ranked against the league's other starters. A stat reads “—” when that player has no recorded snaps for it yet this season (e.g. just back from injury).

CARBryce Young
VS
PHITanner McKee
CAR
85.2
6th / 35
Overall Grade
PHI
70.9
of 35
CAR
91.4
4th / 35
Clean Pocket Grade
PHI
75.8
of 35
CAR
62.3
6th / 35
Pressure Grade
PHI
55.0
of 35
CAR
4.2%
11th / 35
Big Time Throw %
PHI
2.1%
of 35
CAR
0.9%
3rd / 35
Turnover Worthy %
PHI
0.0%
of 35
CAR
2.85s
17th / 35
Avg Time To Throw
PHI
2.30s
of 35
CAR
10.0
5th / 35
Avg Depth of Target
PHI
8.4
of 35

Efficiency and Scoring

Season-to-date EPA, success rate, and scoring, with each figure's league rank.

Offense
CARPHI
+0.136th/32
EPA / Play
-0.1330th/32
+0.196th/32
EPA / Play (Passing)
-0.1225th/32
+0.017th/32
EPA / Play (Rushing)
-0.1727th/32
45.0%15th/32
Success Rate
39.4%31st/32
45.0%19th/32
Success Rate (Passing)
40.1%29th/32
45.1%6th/32
Success Rate (Rushing)
38.1%25th/32
30.34th/32
Points Per Game
18.429th/32
Defense
CARPHI
-0.0118th/32
EPA / Play
+0.0826th/32
+0.0015th/32
EPA / Play (Passing)
+0.1324th/32
-0.0225th/32
EPA / Play (Rushing)
+0.0131st/32
43.2%8th/32
Success Rate
45.1%19th/32
45.2%11th/32
Success Rate (Passing)
46.4%16th/32
39.3%9th/32
Success Rate (Rushing)
43.2%22nd/32
27.326th/32
Points Per Game
22.414th/32

Pressure Matchup

Each team's O-line pressure allowed against the other team's pass rush generated.

When Carolina Panthers have the ball
CAR pressure allowed44.5%30th of 32
→
PHI pressure generated32.9%25th of 32
When Philadelphia Eagles have the ball
PHI pressure allowed42.7%27th of 32
→
CAR pressure generated39.4%8th of 32

Team Grades

Both teams' own season-to-date PFF grades, side by side.

Grades ranked all 32 teams
CAR
80.8
3rd / 32
Overall
PHI
70.2
26th / 32
CAR
78.6
4th / 32
Offense
PHI
66.7
23rd / 32
CAR
63.9
20th / 32
Defense
PHI
63.6
21st / 32
CAR
87.1
9th / 32
Special Teams
PHI
75.6
21st / 32
CAR
81.7
4th / 32
Passing Offense
PHI
56.0
24th / 32
CAR
78.6
10th / 32
Rushing Offense
PHI
82.5
5th / 32
CAR
77.5
3rd / 32
Receiving
PHI
66.7
25th / 32
CAR
66.2
11th / 32
Offensive Line
PHI
63.2
18th / 32
CAR
71.8
9th / 32
Pass Rush
PHI
64.3
29th / 32
CAR
64.2
15th / 32
Coverage
PHI
58.4
18th / 32
CAR
52.2
30th / 32
Run Defense
PHI
64.6
13th / 32
🔒

Unlock Matchups & Betting Edge

PFF player grades, lineup matchups, and betting-line insights for every game are a free-account feature. This one's part of the paid slate — the Game of the Week is always free to view in full.

Sign Up Free