San Francisco 49ers vs Seattle Seahawks — Win Probability


Injury Report
The latest official designations and practice participation for both teams.
- DTJames Thompson Jr.Out
- FBKyle JuszczykOut
- SMarques SigleOut
- DENick BosaOut
- DEMykel WilliamsQuestionable
- CBUpton StoutQuestionable
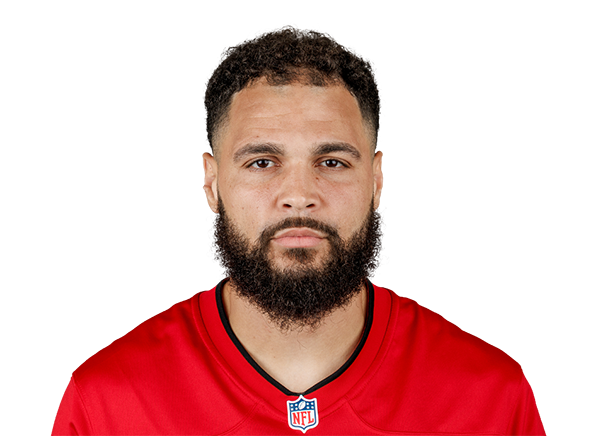
- WRMike EvansLimited
- LBJaden DuggerFull
- RBKaelon BlackFull
- DERomello HeightFull
- LBChazz SurrattOut
- CBJulian NealOut
- RBZach CharbonnetOut
- RBGeorge HolaniQuestionable
- WRIrvin CharlesQuestionable
- GBeau StephensFull
- DTLeonard WilliamsFull
- CBNehemiah PritchettFull
- LBPatrick O'ConnellFull
- STy OkadaFull
- LBTyrice KnightFull
Prediction vs. Result
We keep every prediction permanently so we can always show our work.
49ers Stun Seahawks as Model Whiffs on Seattle Upset
San Francisco's 32-29 victory over Seattle in Week 5 was an upset—and it was the kind that exposes real model error, not just variance.
Before kickoff, Matrix's simulation gave the 49ers only a 41% win probability despite being 5-0. The model projected San Francisco to score 21.7 points and Seattle to score 24.7, forecasting a 3-point Seahawks victory. The market agreed on the direction: Seattle was favored by 3 points.
What actually happened: San Francisco outscored Seattle 32-29, winning by 3 points. That's a 6-point swing from the model's expected margin of -3.
The gap matters. The model didn't just miss the winner—it reversed the outcome entirely while getting the spread magnitude almost right. San Francisco scored 10.3 points above projection. Seattle scored 4.3 points above projection. The 49ers' offensive performance was the primary driver of the upset; the model significantly underestimated their scoring capacity in this matchup.
This wasn't a coin-flip miss. A 41% win probability for an undefeated team on the road suggests the model saw something structural that didn't hold up. Whether that was overweighting Seattle's strength, underrating San Francisco's consistency, or both, the model's read of this game was materially wrong.
The 49ers improved to 5-0. Seattle fell to 3-2. Both teams executed better or worse than pre-game expectations suggested they would. For a projection system calibrated to factual accuracy, this is the kind of miss worth examining: not close, not a reasonable variance band, but a complete reversal of the likely outcome.
Margin of Victory — Seattle Seahawks (Home)
Pregame odds for every possible outcome, simulated before kickoff -- the highlighted bar is what actually happened.
Total Score — Over / Under
Combined final score against five common lines, plus this game's actual market line -- the real combined score was 61.
Unlock Full Game Stats
Margin-of-victory breakdowns and total-score probabilities for every game are a free-account feature. This one's part of the paid slate — the Game of the Week is always free to view in full.
Sign Up Free