IND22
FINAL
34PIT
← back to predictions

Indianapolis Colts vs Pittsburgh Steelers — Win Probability


FINAL
Indianapolis Colts logo
Indianapolis Colts
2-2
22
VS
Pittsburgh Steelers logo
Pittsburgh Steelers
2-2
34
Market line: PIT -3.0, total 41.5 · Model expected score: Indianapolis Colts 19.3 – Pittsburgh Steelers 22.3
Ad space

Injury Report

The latest official designations and practice participation for both teams.

IND
  • DEArden KeyOut
  • WRAshton DulinOut
  • LBJaylon CarliesOut
  • TEWill MalloryOut
  • WRDarius SlaytonQuestionable
  • LBAkeem Davis-GaitherFull
  • CTanor BortoliniFull
PIT
  • SDeShon ElliottOut
  • CBJamel DeanOut
  • WRMichael PittmanOut
  • CBJalen RamseyQuestionable
  • RBRico DowdleQuestionable

Prediction vs. Result

We keep every prediction permanently so we can always show our work.

PREGAME WIN PROBABILITY
Steelers 59%
ACTUAL RESULT
Pittsburgh Steelers won by 12
COMBINED SCORE
56

Model Underestimated Pittsburgh in Comfortable Win Over Indianapolis

The Pittsburgh Steelers' 34-22 victory over Indianapolis on Sunday was more decisive than pregame projections suggested, though the model correctly identified Pittsburgh as the favorite.

Before kickoff, the model expected Pittsburgh to win by 3 points, with a final score of 22.3 to 19.3. The market agreed on the spread, setting Pittsburgh as a 3-point favorite. Pittsburgh's win probability stood at 59%, reflecting a modest but clear edge.

The actual result differed meaningfully from that projection. Pittsburgh scored 34 points and Indianapolis 22, producing a 12-point margin—four times larger than the expected 3-point differential. The Steelers' actual output exceeded the model's expectation by 11.7 points, while the Colts fell short by 2.7 points.

This was not an upset—Pittsburgh was favored and won—but it was a more dominant performance than the pregame simulation anticipated. The model's 59% win probability for Pittsburgh proved directionally correct, yet it underestimated the magnitude of the Steelers' advantage. A 3-point expected margin closing as a 12-point actual margin represents a substantial gap between projection and reality.

For Pittsburgh (3-2), the win confirmed the pregame lean but exceeded it in scale. For Indianapolis (2-3), the result landed worse than the neutral expectation would have suggested. The model's framework correctly identified Pittsburgh as the more likely winner, but the simulation underestimated Pittsburgh's offensive output and the defensive dominance that produced the final spread. This gap suggests either Pittsburgh played significantly above its pregame baseline, Indianapolis underperformed its projection, or both.

Ad space

Margin of Victory — Pittsburgh Steelers (Home)

Pregame odds for every possible outcome, simulated before kickoff -- the highlighted bar is what actually happened.

Lost / Tied
41%
Won by 1-3
9%
Won by 4-7
12%
Won by 8-14 ← actual result
18%
Won by 15-21
12%
Won by 21+
9%

Total Score — Over / Under

Combined final score against five common lines, plus this game's actual market line -- the real combined score was 56.

O/U LINE 30
81% over ✓19% under
O/U LINE 40
55% over ✓45% under
O/U LINE 41.5 MARKET LINE
50% over ✓50% under
O/U LINE 44
43% over ✓57% under
O/U LINE 48
31% over ✓69% under
O/U LINE 52
22% over ✓78% under
🔒

Unlock Full Game Stats

Margin-of-victory breakdowns and total-score probabilities for every game are a free-account feature. This one's part of the paid slate — the Game of the Week is always free to view in full.

Sign Up Free

Every number above comes from the model's live prediction data — 100,000 Monte Carlo simulations, grounded in the market line at generation time.

Ad space

Highest Graded Players

Season-to-date PFF grades for each team's top graded players, minimum 25% of that side's snaps.

IND
Quenton NelsonG
89.2
Matt GoncalvesG
75.8
Bernhard RaimannT
74.5
Tyler WarrenTE
73.1
Josh DownsWR
72.0
PIT
Mason McCormickG
78.1
Jaylen WarrenHB
78.1
Zach FrazierC
77.1
Dylan CookT
76.4
Darnell WashingtonTE
72.3

QB Matchup

Each team's real current starting QB (per PFF's own depth chart) -- season-to-date PFF grades and passing profile, ranked against the league's other starters. A stat reads “—” when that player has no recorded snaps for it yet this season (e.g. just back from injury).

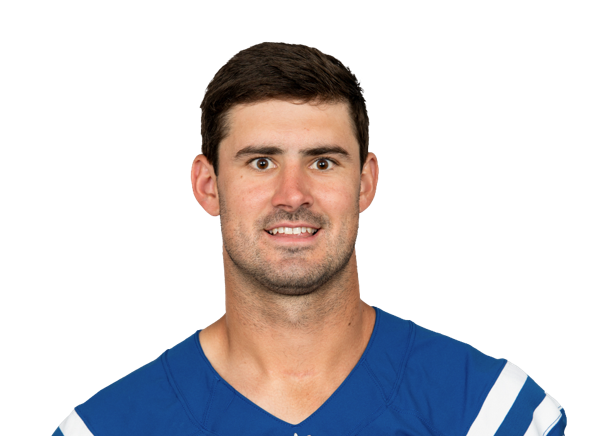
INDDaniel Jones
VS
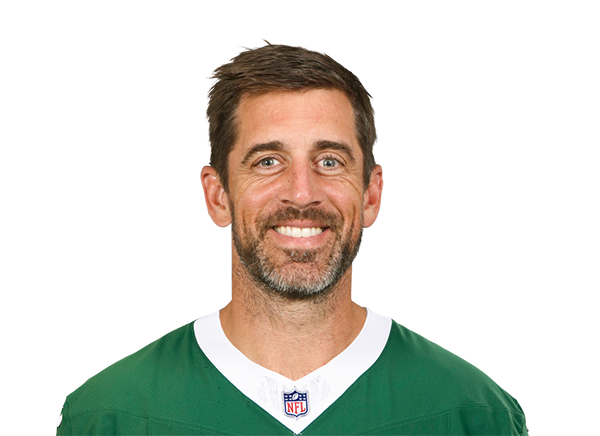
PITAaron Rodgers
IND
51.4
31st / 35
Overall Grade
PIT
65.3
21st / 35
IND
60.6
31st / 35
Clean Pocket Grade
PIT
71.5
26th / 35
IND
36.1
27th / 35
Pressure Grade
PIT
50.7
13th / 35
IND
2.7%
28th / 35
Big Time Throw %
PIT
3.2%
23rd / 35
IND
6.0%
35th / 35
Turnover Worthy %
PIT
2.1%
10th / 35
IND
2.77s
14th / 35
Avg Time To Throw
PIT
2.61s
5th / 35
IND
8.4
17th / 35
Avg Depth of Target
PIT
7.5
25th / 35

Efficiency and Scoring

Season-to-date EPA, success rate, and scoring, with each figure's league rank.

Offense
INDPIT
-0.0522nd/32
EPA / Play
-0.0824th/32
-0.1227th/32
EPA / Play (Passing)
-0.1124th/32
+0.073rd/32
EPA / Play (Rushing)
-0.0110th/32
43.0%20th/32
Success Rate
42.4%22nd/32
42.3%25th/32
Success Rate (Passing)
43.7%23rd/32
44.0%12th/32
Success Rate (Rushing)
39.8%21st/32
24.811th/32
Points Per Game
22.218th/32
Defense
INDPIT
+0.0724th/32
EPA / Play
-0.075th/32
+0.1223rd/32
EPA / Play (Passing)
-0.075th/32
-0.0029th/32
EPA / Play (Rushing)
-0.0618th/32
45.3%21st/32
Success Rate
43.8%12th/32
46.7%17th/32
Success Rate (Passing)
45.4%12th/32
43.4%23rd/32
Success Rate (Rushing)
41.3%17th/32
27.627th/32
Points Per Game
21.810th/32

Pressure Matchup

Each team's O-line pressure allowed against the other team's pass rush generated.

When Indianapolis Colts have the ball
IND pressure allowed36.9%19th of 32
→
PIT pressure generated33.9%23rd of 32
When Pittsburgh Steelers have the ball
PIT pressure allowed34.1%13th of 32
→
IND pressure generated28.6%29th of 32

Team Grades

Both teams' own season-to-date PFF grades, side by side.

Grades ranked all 32 teams
IND
72.5
21st / 32
Overall
PIT
79.7
8th / 32
IND
69.3
21st / 32
Offense
PIT
71.4
17th / 32
IND
60.0
27th / 32
Defense
PIT
77.6
1st / 32
IND
84.2
14th / 32
Special Teams
PIT
59.1
31st / 32
IND
48.6
30th / 32
Passing Offense
PIT
67.2
19th / 32
IND
68.1
21st / 32
Rushing Offense
PIT
78.7
9th / 32
IND
71.0
19th / 32
Receiving
PIT
64.8
28th / 32
IND
71.0
2nd / 32
Offensive Line
PIT
71.0
4th / 32
IND
69.9
14th / 32
Pass Rush
PIT
74.0
6th / 32
IND
46.3
28th / 32
Coverage
PIT
72.2
7th / 32
IND
60.3
20th / 32
Run Defense
PIT
78.5
1st / 32
🔒

Unlock Matchups & Betting Edge

PFF player grades, lineup matchups, and betting-line insights for every game are a free-account feature. This one's part of the paid slate — the Game of the Week is always free to view in full.

Sign Up Free