DET45
FINAL
21ARI
← back to predictions

Detroit Lions vs Arizona Cardinals — Win Probability


FINAL
Detroit Lions logo
Detroit Lions
2-2
45
VS
Arizona Cardinals logo
Arizona Cardinals
1-3
21
Market line: DET -5.5, total 54.5 · Model expected score: Detroit Lions 30.1 – Arizona Cardinals 24.5
Ad space

Injury Report

The latest official designations and practice participation for both teams.

DET
  • GBen BartchOut
  • SBrian BranchOut
  • CCade MaysOut
  • CBRock Ya-SinOut
  • DTTyleik WilliamsQuestionable
  • DED.J. WonnumFull
ARI
  • SAndrew WingardOut
  • GIsaiah AdamsOut
  • LBKarson ShararQuestionable
  • DTWalter NolenQuestionable
  • SDadrion Taylor-DemersonFull
  • RBJeremiyah LoveFull

Prediction vs. Result

We keep every prediction permanently so we can always show our work.

PREGAME WIN PROBABILITY
Lions 66%
ACTUAL RESULT
Detroit Lions won by 24
COMBINED SCORE
66

Detroit's 45-21 Win Over Arizona Far Exceeded Model's Conservative Projection

Detroit's 45-21 victory over Arizona was not an upset—the model favored the Lions at 66% win probability pregame—but the final margin obliterated the projection by a substantial distance.

The model's pregame simulation expected Detroit to score 30.1 points and Arizona 24.5, yielding an expected margin of 5.5 points. The market betting line matched that projection exactly at 5.5 points, Detroit favored. Both the model and the market were aligned on a moderately comfortable Lions win.

What actually happened was fundamentally different in scale. Detroit scored 45 points—15 more than projected—while holding Arizona to 21, a full 3.5 points below expectation. The 24-point actual margin was 18.5 points wider than the model forecast.

This represents a significant miss, though directionally correct. The model called the winner and the favorite accurately, and its 66% confidence in Detroit was vindicated. But the magnitude of Detroit's dominance was not captured in the pregame simulation. Arizona's offensive production fell well short of the model's already modest 24.5-point expectation, while Detroit's offensive output exceeded projection by nearly 50%.

For a model whose entire function is precision in point-spread and score projection, an 18.5-point gap between expected and actual margin is material. The Lions were better than the model assessed, or Arizona was worse, or both. The 1-4 record Arizona carries into week 6 suggests underlying weakness that may not have been fully weighted. Detroit's 3-2 record sits between its pre-game projection strength and post-game reality.

The model got the game right in binary terms. It got the game wrong in magnitude.

Ad space

Margin of Victory — Arizona Cardinals (Home)

Pregame odds for every possible outcome, simulated before kickoff -- the highlighted bar is what actually happened.

Lost / Tied ← actual result
66%
Won by 1-3
8%
Won by 4-7
9%
Won by 8-14
10%
Won by 15-21
5%
Won by 21+
2%

Total Score — Over / Under

Combined final score against five common lines, plus this game's actual market line -- the real combined score was 66.

O/U LINE 30
97% over ✓3% under
O/U LINE 40
86% over ✓14% under
O/U LINE 44
79% over ✓21% under
O/U LINE 48
69% over ✓31% under
O/U LINE 52
58% over ✓42% under
O/U LINE 54.5 MARKET LINE
50% over ✓50% under
🔒

Unlock Full Game Stats

Margin-of-victory breakdowns and total-score probabilities for every game are a free-account feature. This one's part of the paid slate — the Game of the Week is always free to view in full.

Sign Up Free
Every number above comes from the model's live prediction data — 100,000 Monte Carlo simulations, grounded in the market line at generation time.

Ad space

Highest Graded Players

Season-to-date PFF grades for each team's top graded players, minimum 25% of that side's snaps.

DET
Penei SewellT
90.9
Jahmyr GibbsHB
88.3
Christian MahoganyG
86.4
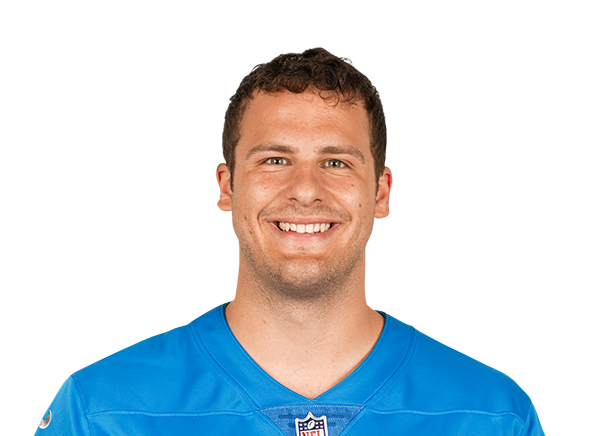
Jared GoffQB
86.3
Sam LaPortaTE
80.6
ARI
Elijah HigginsTE
86.2
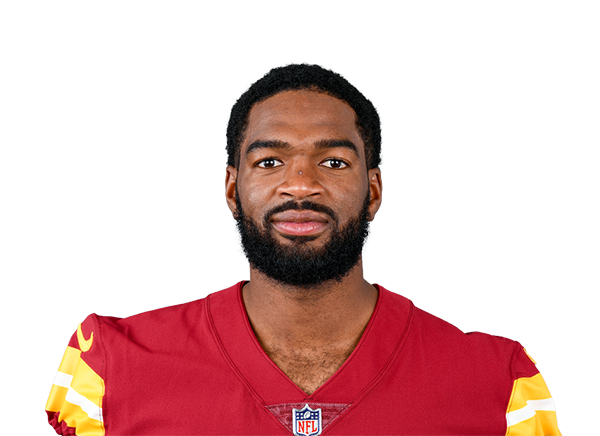
Jacoby BrissettQB
80.3
Paris Johnson Jr.T
77.6
Michael WilsonWR
73.9
Jon Gaines IIG
71.9

QB Matchup

Each team's real current starting QB (per PFF's own depth chart) -- season-to-date PFF grades and passing profile, ranked against the league's other starters. A stat reads “—” when that player has no recorded snaps for it yet this season (e.g. just back from injury).

DETJared Goff
VS
ARIJacoby Brissett
DET
86.3
4th / 35
Overall Grade
ARI
80.3
10th / 35
DET
88.1
10th / 35
Clean Pocket Grade
ARI
83.6
16th / 35
DET
71.6
2nd / 35
Pressure Grade
ARI
45.8
17th / 35
DET
4.6%
9th / 35
Big Time Throw %
ARI
2.0%
30th / 35
DET
0.5%
1st / 35
Turnover Worthy %
ARI
2.3%
12th / 35
DET
2.76s
13th / 35
Avg Time To Throw
ARI
2.52s
2nd / 35
DET
8.8
12th / 35
Avg Depth of Target
ARI
7.4
27th / 35

Efficiency and Scoring

Season-to-date EPA, success rate, and scoring, with each figure's league rank.

Offense
DETARI
+0.193rd/32
EPA / Play
-0.0216th/32
+0.293rd/32
EPA / Play (Passing)
-0.0021st/32
+0.036th/32
EPA / Play (Rushing)
-0.0415th/32
51.8%2nd/32
Success Rate
49.0%8th/32
53.6%3rd/32
Success Rate (Passing)
51.6%8th/32
48.8%2nd/32
Success Rate (Rushing)
44.7%9th/32
32.81st/32
Points Per Game
21.623rd/32
Defense
DETARI
+0.1631st/32
EPA / Play
+0.1129th/32
+0.2428th/32
EPA / Play (Passing)
+0.2830th/32
-0.0126th/32
EPA / Play (Rushing)
-0.109th/32
49.6%31st/32
Success Rate
47.4%26th/32
54.5%30th/32
Success Rate (Passing)
49.2%24th/32
39.1%7th/32
Success Rate (Rushing)
45.2%28th/32
29.629th/32
Points Per Game
32.432nd/32

Pressure Matchup

Each team's O-line pressure allowed against the other team's pass rush generated.

When Detroit Lions have the ball
DET pressure allowed33.7%12th of 32
→
ARI pressure generated30.4%27th of 32
When Arizona Cardinals have the ball
ARI pressure allowed25.8%1st of 32
→
DET pressure generated36.9%17th of 32

Team Grades

Both teams' own season-to-date PFF grades, side by side.

Grades ranked all 32 teams
DET
83.3
1st / 32
Overall
ARI
76.6
11th / 32
DET
79.2
2nd / 32
Offense
ARI
80.5
1st / 32
DET
71.9
6th / 32
Defense
ARI
51.4
32nd / 32
DET
75.7
19th / 32
Special Teams
ARI
91.2
3rd / 32
DET
79.0
6th / 32
Passing Offense
ARI
85.5
1st / 32
DET
76.0
13th / 32
Rushing Offense
ARI
84.0
2nd / 32
DET
76.8
6th / 32
Receiving
ARI
77.5
3rd / 32
DET
71.0
2nd / 32
Offensive Line
ARI
65.7
13th / 32
DET
83.5
1st / 32
Pass Rush
ARI
68.2
20th / 32
DET
52.1
24th / 32
Coverage
ARI
39.0
32nd / 32
DET
72.6
3rd / 32
Run Defense
ARI
51.8
31st / 32
🔒

Unlock Matchups & Betting Edge

PFF player grades, lineup matchups, and betting-line insights for every game are a free-account feature. This one's part of the paid slate — the Game of the Week is always free to view in full.

Sign Up Free