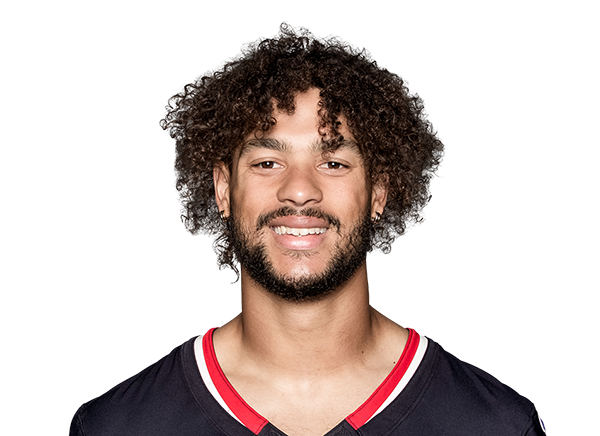
DAL34
FINAL
30HOU
← back to predictions

Dallas Cowboys vs Houston Texans — Win Probability


FINAL
Dallas Cowboys logo
Dallas Cowboys
1-2
34
VS
Houston Texans logo
Houston Texans
0-3
30
Market line: HOU -3.0, total 48.5 · Model expected score: Dallas Cowboys 22.8 – Houston Texans 25.8
Ad space

Injury Report

The latest official designations and practice participation for both teams.

DAL
  • CBCobie DurantOut
  • LBDeMarvion OvershownOut
  • LBJames HoustonFull
  • SMalik HookerFull
  • CBShavon Revel Jr.Full
HOU
  • LBAzeez Al-ShaairOut
  • SM.J. StewartOut
  • GEd IngramQuestionable
  • DEJadeveon ClowneyQuestionable
  • LBJake HansenQuestionable
  • DELogan HallQuestionable
  • RBBritish BrooksDNP
  • SCalen BullockFull
  • WRNico CollinsFull
  • TTrent BrownFull
  • LBWade WoodazFull
  • DEWill Anderson Jr.Full

Prediction vs. Result

We keep every prediction permanently so we can always show our work.

PREGAME WIN PROBABILITY
Texans 59%
ACTUAL RESULT
Dallas Cowboys won by 4
COMBINED SCORE
64

Dallas upsets Houston as model underestimated Cowboys in 34-30 shocker

The model projected Houston to win by 3 points and gave Dallas just a 41% win probability before kickoff. The market agreed, installing Houston as a 3-point favorite. Dallas had other ideas, winning 34-30 in an upset that exposed a significant gap between the pregame projection and reality.

The expected margin favored Houston by 3 points (model: 25.8 Houston, 22.8 Dallas). The actual result flipped that entirely—Dallas won by 4. That's a 7-point swing from projection to outcome, well beyond the range of normal variance.

What made this particularly notable: the model's win probability for Dallas (41%) and the market's spread (Houston -3) were aligned in their pessimism about the Cowboys. Neither expected Dallas to pull this off. Yet Dallas scored 34 points against a model projection of 22.8, a 11.2-point outperformance. Houston scored 30 against an expected 25.8, a 4.2-point beat in their own right, but it wasn't enough.

For a site built on factual honesty, the important observation is straightforward: the model significantly underestimated Dallas's offensive capability in this matchup. The Cowboys didn't just win—they won convincingly despite being underdogs in both the model's simulation and the market's assessment. Houston's 0-4 record after this loss and Dallas's 2-2 mark underscore the real-world stakes.

This was not a close miss. A 7-point margin error is substantial. The model saw Houston as the clear favorite and Dallas as the underdog; instead, Dallas controlled the game enough to win by a field goal. Whether this reflects a personnel adjustment, schematic advantage, or simple execution edge on the day, the gap between projection and outcome was too large to ignore.

Ad space

Margin of Victory — Houston Texans (Home)

Pregame odds for every possible outcome, simulated before kickoff -- the highlighted bar is what actually happened.

Lost / Tied ← actual result
41%
Won by 1-3
9%
Won by 4-7
12%
Won by 8-14
18%
Won by 15-21
12%
Won by 21+
9%

Total Score — Over / Under

Combined final score against five common lines, plus this game's actual market line -- the real combined score was 64.

O/U LINE 30
92% over ✓8% under
O/U LINE 40
74% over ✓26% under
O/U LINE 44
63% over ✓37% under
O/U LINE 48
52% over ✓48% under
O/U LINE 48.5 MARKET LINE
50% over ✓50% under
O/U LINE 52
40% over ✓60% under
🔒

Unlock Full Game Stats

Margin-of-victory breakdowns and total-score probabilities for every game are a free-account feature. This one's part of the paid slate — the Game of the Week is always free to view in full.

Sign Up Free
Every number above comes from the model's live prediction data — 100,000 Monte Carlo simulations, grounded in the market line at generation time.

Ad space

Highest Graded Players

Season-to-date PFF grades for each team's top graded players, minimum 25% of that side's snaps.

DAL
CeeDee LambWR
88.6
Dak PrescottQB
83.2
Tyler BookerG
76.0
Tyler SmithG
75.6
George PickensWR
74.6
HOU
C.J. StroudQB
85.7
Nico CollinsWR
84.2
Jaylin NoelWR
81.0
Xavier HutchinsonWR
72.8
Wyatt TellerG
69.4

QB Matchup

Each team's real current starting QB (per PFF's own depth chart) -- season-to-date PFF grades and passing profile, ranked against the league's other starters. A stat reads “—” when that player has no recorded snaps for it yet this season (e.g. just back from injury).

DALDak Prescott
VS
HOUC.J. Stroud
DAL
83.2
8th / 35
Overall Grade
HOU
85.7
5th / 35
DAL
92.4
2nd / 35
Clean Pocket Grade
HOU
88.2
9th / 35
DAL
51.0
12th / 35
Pressure Grade
HOU
65.9
3rd / 35
DAL
3.4%
21st / 35
Big Time Throw %
HOU
5.9%
4th / 35
DAL
2.4%
13th / 35
Turnover Worthy %
HOU
1.1%
5th / 35
DAL
2.75s
12th / 35
Avg Time To Throw
HOU
2.80s
16th / 35
DAL
7.8
22nd / 35
Avg Depth of Target
HOU
10.4
2nd / 35

Efficiency and Scoring

Season-to-date EPA, success rate, and scoring, with each figure's league rank.

Offense
DALHOU
+0.098th/32
EPA / Play
+0.0611th/32
+0.1212th/32
EPA / Play (Passing)
+0.169th/32
+0.018th/32
EPA / Play (Rushing)
-0.1223rd/32
50.9%3rd/32
Success Rate
44.4%19th/32
52.5%5th/32
Success Rate (Passing)
49.8%14th/32
47.3%4th/32
Success Rate (Rushing)
34.6%31st/32
27.67th/32
Points Per Game
22.019th/32
Defense
DALHOU
+0.1832nd/32
EPA / Play
+0.0220th/32
+0.3732nd/32
EPA / Play (Passing)
+0.0921st/32
-0.0419th/32
EPA / Play (Rushing)
-0.108th/32
49.5%30th/32
Success Rate
44.4%15th/32
56.5%31st/32
Success Rate (Passing)
45.5%13th/32
40.9%15th/32
Success Rate (Rushing)
42.3%19th/32
27.225th/32
Points Per Game
22.414th/32

Pressure Matchup

Each team's O-line pressure allowed against the other team's pass rush generated.

When Dallas Cowboys have the ball
DAL pressure allowed34.3%14th of 32
→
HOU pressure generated37.1%14th of 32
When Houston Texans have the ball
HOU pressure allowed33.6%11th of 32
→
DAL pressure generated34.3%22nd of 32

Team Grades

Both teams' own season-to-date PFF grades, side by side.

Grades ranked all 32 teams
DAL
73.0
20th / 32
Overall
HOU
76.1
12th / 32
DAL
78.4
5th / 32
Offense
HOU
72.3
12th / 32
DAL
51.8
31st / 32
Defense
HOU
66.9
15th / 32
DAL
66.3
28th / 32
Special Teams
HOU
60.7
30th / 32
DAL
85.3
2nd / 32
Passing Offense
HOU
70.4
16th / 32
DAL
68.3
20th / 32
Rushing Offense
HOU
72.3
16th / 32
DAL
76.6
9th / 32
Receiving
HOU
77.2
5th / 32
DAL
64.1
15th / 32
Offensive Line
HOU
59.6
26th / 32
DAL
67.9
21st / 32
Pass Rush
HOU
69.8
15th / 32
DAL
42.8
30th / 32
Coverage
HOU
56.0
21st / 32
DAL
50.8
32nd / 32
Run Defense
HOU
69.4
6th / 32
🔒

Unlock Matchups & Betting Edge

PFF player grades, lineup matchups, and betting-line insights for every game are a free-account feature. This one's part of the paid slate — the Game of the Week is always free to view in full.

Sign Up Free