SEA31
FINAL
33WAS
← back to predictions

Seattle Seahawks vs Washington Commanders — Win Probability


FINAL
Seattle Seahawks logo
Seattle Seahawks
2-0
31
VS
Washington Commanders logo
Washington Commanders
0-2
33
Market line: SEA -8.5, total 40.5 · Model expected score: Seattle Seahawks 24.5 – Washington Commanders 16.0
Ad space

Injury Report

The latest official designations and practice participation for both teams.

SEA
  • QBSam DarnoldFull
  • SJulian LoveOut
  • STy OkadaOut
  • DTBrandon PiliQuestionable
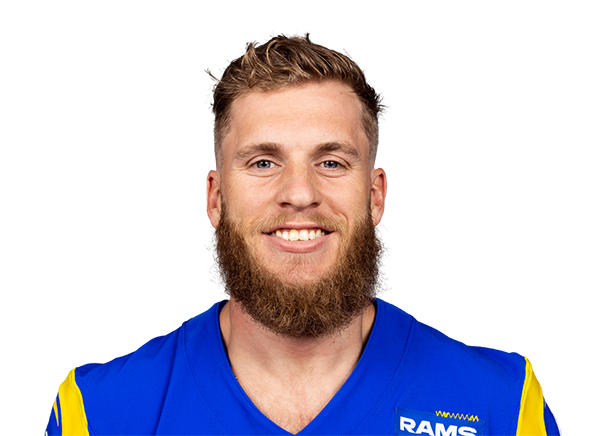
  • WRCooper KuppLimited
  • FBBrady RussellFull
  • LBErnest JonesFull
  • RBGeorge HolaniFull
  • RBJadarian PriceFull
  • SNick EmmanworiFull
WAS
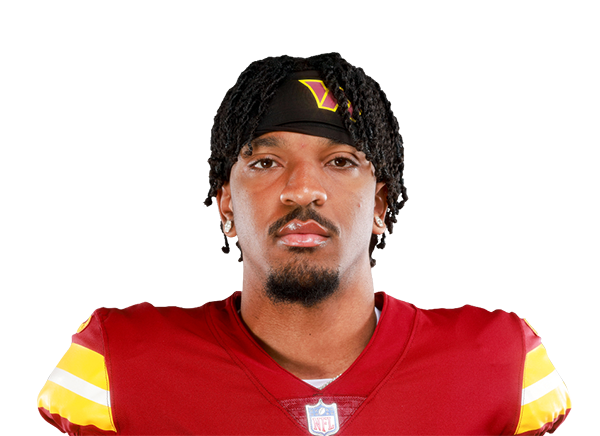
  • QBJayden DanielsOut
  • TEChig OkonkwoOut
  • LBFrankie LuvuOut
  • SNick CrossOut
  • GSam CosmiOut
  • LBLeo ChenalLimited
  • TBrandon ColemanFull
  • DECharles OmenihuFull
  • LBDorance ArmstrongFull
  • KDrew StevensFull
  • DTJavon KinlawFull
  • WRJaylin LaneFull
  • SJeremy ReavesFull
  • RBKaytron AllenFull
  • SPercy ButlerFull
  • STyler OwensFull

Prediction vs. Result

We keep every prediction permanently so we can always show our work.

PREGAME WIN PROBABILITY
Seahawks 74%
ACTUAL RESULT
Washington Commanders won by 2
COMBINED SCORE
64

Washington Stuns Seattle as 8.5-Point Underdog in Week 3 Upset

The model had this one decisively wrong. Seattle entered Sunday as a heavy favorite with an 8.5-point spread and a 74% win probability in the simulation. Washington was given only a 26% chance to win and projected to score just 16 points in a predicted 24.5-16 loss.

Instead, Washington won 33-31—a two-point victory that inverted the entire pregame forecast. The upset magnitude was substantial: the model expected Seattle to win by 8.5 points, but Washington won by 2, a 10.5-point swing from projection to result.

The scoring pattern also diverged sharply from simulation. Washington's 33 points exceeded the model's projection by 17 points. Seattle's 31 points exceeded its projection of 24.5 by 6.5 points. This was not a defensive slugfest or a low-scoring upset—both teams scored well above their expected output, but Washington's offensive performance relative to projection was the decisive difference.

The market line (8.5 points favoring Seattle) and the model's 74% win probability for Seattle were aligned. Both were wrong in the same direction, suggesting the pregame consensus simply underestimated Washington's capability or overestimated Seattle's. This was not a case where the model diverged from smart money and lost; both agreed on Seattle, and both were proven incorrect.

For a Week 3 result, this represents a substantial model miss—not a narrow call that could have gone either way, but a full-scale inversion of the favored outcome. Washington moved to 1-2 on the season while Seattle fell to 2-1, both contrary to the pregame expectations that heavily favored the Seahawks.

Ad space

Margin of Victory — Washington Commanders (Home)

Pregame odds for every possible outcome, simulated before kickoff -- the highlighted bar is what actually happened.

Lost / Tied
74%
Won by 1-3 ← actual result
7%
Won by 4-7
7%
Won by 8-14
8%
Won by 15-21
3%
Won by 21+
1%

Total Score — Over / Under

Combined final score against five common lines, plus this game's actual market line -- the real combined score was 64.

O/U LINE 30
78% over ✓22% under
O/U LINE 40
52% over ✓48% under
O/U LINE 40.5 MARKET LINE
50% over ✓50% under
O/U LINE 44
40% over ✓60% under
O/U LINE 48
29% over ✓71% under
O/U LINE 52
19% over ✓81% under
🔒

Unlock Full Game Stats

Margin-of-victory breakdowns and total-score probabilities for every game are a free-account feature. This one's part of the paid slate — the Game of the Week is always free to view in full.

Sign Up Free
Every number above comes from the model's live prediction data — 100,000 Monte Carlo simulations, grounded in the market line at generation time.

Ad space

Highest Graded Players

Season-to-date PFF grades for each team's top graded players, minimum 25% of that side's snaps.

SEA
Jaxon Smith-NjigbaWR
92.2
Drew LockQB
92.1
Charles CrossT
79.1
Abraham LucasT
68.4
Cooper KuppWR
65.5
WAS
Sam CosmiG
80.8
Jayden DanielsQB
77.3
Antonio WilliamsWR
72.7
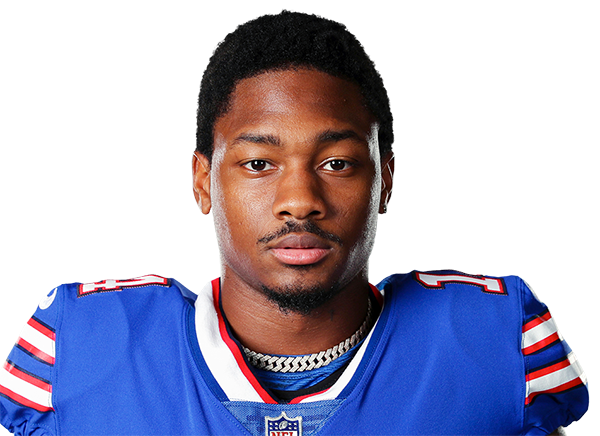
Stefon DiggsWR
66.8
Terry McLaurinWR
66.7

QB Matchup

Each team's real current starting QB (per PFF's own depth chart) -- season-to-date PFF grades and passing profile, ranked against the league's other starters. A stat reads “—” when that player has no recorded snaps for it yet this season (e.g. just back from injury).

SEASam Darnold
VS
WASJayden Daniels
SEA
64.2
25th / 35
Overall Grade
WAS
77.3
12th / 35
SEA
79.7
20th / 35
Clean Pocket Grade
WAS
84.8
15th / 35
SEA
38.9
24th / 35
Pressure Grade
WAS
34.9
28th / 35
SEA
4.5%
10th / 35
Big Time Throw %
WAS
1.2%
34th / 35
SEA
5.7%
32nd / 35
Turnover Worthy %
WAS
1.0%
4th / 35
SEA
3.08s
24th / 35
Avg Time To Throw
WAS
3.16s
30th / 35
SEA
8.1
21st / 35
Avg Depth of Target
WAS
9.2
8th / 35

Efficiency and Scoring

Season-to-date EPA, success rate, and scoring, with each figure's league rank.

Offense
SEAWAS
-0.0723rd/32
EPA / Play
+0.0015th/32
+0.0419th/32
EPA / Play (Passing)
+0.0916th/32
-0.2230th/32
EPA / Play (Rushing)
-0.1222nd/32
44.6%18th/32
Success Rate
40.6%25th/32
47.5%16th/32
Success Rate (Passing)
44.6%20th/32
40.5%18th/32
Success Rate (Rushing)
34.6%30th/32
26.88th/32
Points Per Game
23.017th/32
Defense
SEAWAS
-0.142nd/32
EPA / Play
+0.0523rd/32
-0.132nd/32
EPA / Play (Passing)
+0.1726th/32
-0.174th/32
EPA / Play (Rushing)
-0.191st/32
40.6%3rd/32
Success Rate
47.7%27th/32
44.2%7th/32
Success Rate (Passing)
51.9%27th/32
35.2%4th/32
Success Rate (Rushing)
39.3%8th/32
21.08th/32
Points Per Game
29.830th/32

Pressure Matchup

Each team's O-line pressure allowed against the other team's pass rush generated.

When Seattle Seahawks have the ball
SEA pressure allowed43.0%28th of 32
→
WAS pressure generated33.6%24th of 32
When Washington Commanders have the ball
WAS pressure allowed38.3%22nd of 32
→
SEA pressure generated44.2%2nd of 32

Team Grades

Both teams' own season-to-date PFF grades, side by side.

Grades ranked all 32 teams
SEA
73.4
18th / 32
Overall
WAS
63.7
30th / 32
SEA
70.0
20th / 32
Offense
WAS
65.3
24th / 32
SEA
70.5
10th / 32
Defense
WAS
58.7
28th / 32
SEA
52.1
32nd / 32
Special Teams
WAS
72.6
23rd / 32
SEA
74.7
8th / 32
Passing Offense
WAS
68.4
18th / 32
SEA
53.1
32nd / 32
Rushing Offense
WAS
73.9
14th / 32
SEA
73.1
14th / 32
Receiving
WAS
65.7
27th / 32
SEA
66.0
12th / 32
Offensive Line
WAS
57.9
28th / 32
SEA
68.6
18th / 32
Pass Rush
WAS
61.9
30th / 32
SEA
82.5
2nd / 32
Coverage
WAS
52.8
23rd / 32
SEA
56.0
25th / 32
Run Defense
WAS
59.6
21st / 32
🔒

Unlock Matchups & Betting Edge

PFF player grades, lineup matchups, and betting-line insights for every game are a free-account feature. This one's part of the paid slate — the Game of the Week is always free to view in full.

Sign Up Free