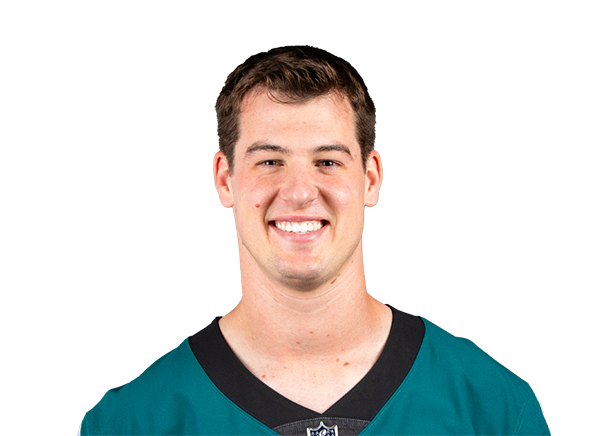
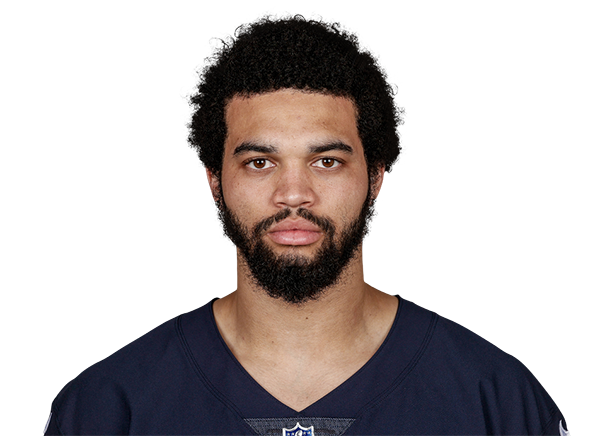
PHI7
FINAL
27CHI
← back to predictions

Philadelphia Eagles vs Chicago Bears — Win Probability


FINAL
Philadelphia Eagles logo
Philadelphia Eagles
2-0
7
VS
Chicago Bears logo
Chicago Bears
1-1
27
Market line: PHI -3.5, total 41.5 · Model expected score: Philadelphia Eagles 22.5 – Chicago Bears 19.0
Ad space

Injury Report

The latest official designations and practice participation for both teams.

PHI
  • TEDallas GoedertOut
  • TFred JohnsonOut
  • WRMarquise BrownOut
  • LBJonathan GreenardQuestionable
  • RBWill ShipleyLimited
  • SAndrew MukubaFull
  • WRDeVonta SmithFull
  • DTJalen CarterFull
  • RBSaquon BarkleyFull
  • RBTank BigsbyFull
  • GTyler SteenFull
CHI
  • QBCaleb WilliamsOut
  • QBTyson BagentQuestionable
  • LBNoah SewellOut
  • DEShemar TurnerOut
  • KCairo SantosFull
  • RBKyle MonangaiFull
  • CBTyrique StevensonFull

Prediction vs. Result

We keep every prediction permanently so we can always show our work.

PREGAME WIN PROBABILITY
Eagles 60%
ACTUAL RESULT
Chicago Bears won by 20
COMBINED SCORE
34

Chicago's 20-Point Upset Over Philadelphia Exposes Model's Pregame Miscalibration

The Chicago Bears defeated Philadelphia 27-7 on Sunday, a 20-point margin that inverted the model's entire read on the game. Before kickoff, the model projected a Philadelphia win by 3.5 points, with the Eagles favored at 40% win probability for Chicago. The market agreed: Philadelphia was a 3.5-point favorite. Neither the model nor the betting line saw what actually happened.

The model's pregame expectation was Philadelphia 22.5, Chicago 19. The actual result: Chicago 27, Philadelphia 7. That's a 24-point swing in Chicago's direction from the projection.

This was a genuine upset. Chicago entered with only a 40% implied win probability in the model's simulation, meaning the Bears were treated as the underdog despite playing at home. Philadelphia was the clear favorite on both the model's internal odds and the published spread. The model's expected margin of -3.5 (favoring Philadelphia) became a +20 actual margin (favoring Chicago), a gap of 23.5 points between what was modeled and what occurred.

For a projection system built on historical tendencies and measurable inputs, this represents a substantial miss. The model did not anticipate a Bears team that would outscore Philadelphia by 20 in a head-to-head matchup. Whether Chicago's dominant performance reflected variables the model underweighted—offensive execution, defensive pressure, or Philadelphia's unpreparedness—or whether randomness simply broke decisively one direction, the numbers show a clear divergence between pregame expectation and Sunday's result.

Both teams enter Week 4 at 2-1. The model's projection accuracy will depend on whether this performance signals a systematic misread of these teams' true strength or represents the normal variance that occurs across a 17-week season.

Ad space

Margin of Victory — Chicago Bears (Home)

Pregame odds for every possible outcome, simulated before kickoff -- the highlighted bar is what actually happened.

Lost / Tied
60%
Won by 1-3
8%
Won by 4-7
10%
Won by 8-14
12%
Won by 15-21 ← actual result
6%
Won by 21+
3%

Total Score — Over / Under

Combined final score against five common lines, plus this game's actual market line -- the real combined score was 34.

O/U LINE 30
81% over ✓19% under
O/U LINE 40
54% over46% under ✓
O/U LINE 41.5 MARKET LINE
50% over50% under ✓
O/U LINE 44
43% over57% under ✓
O/U LINE 48
31% over69% under ✓
O/U LINE 52
22% over78% under ✓
🔒

Unlock Full Game Stats

Margin-of-victory breakdowns and total-score probabilities for every game are a free-account feature. This one's part of the paid slate — the Game of the Week is always free to view in full.

Sign Up Free
Every number above comes from the model's live prediction data — 100,000 Monte Carlo simulations, grounded in the market line at generation time.

Ad space

Highest Graded Players

Season-to-date PFF grades for each team's top graded players, minimum 25% of that side's snaps.

PHI
DeVonta SmithWR
90.5
Jordan MailataT
80.6
Lane JohnsonT
79.8
Dallas GoedertTE
76.2
Dontayvion WicksWR
68.9
CHI
Jonah JacksonG
83.7
Darnell WrightT
83.1
Kyle MonangaiHB
74.7
Luther Burden IIIWR
73.7
Kalif RaymondWR
72.6

QB Matchup

Each team's real current starting QB (per PFF's own depth chart) -- season-to-date PFF grades and passing profile, ranked against the league's other starters. A stat reads “—” when that player has no recorded snaps for it yet this season (e.g. just back from injury).

PHITanner McKee
VS
CHICaleb Williams
PHI
70.9
of 35
Overall Grade
CHI
65.2
22nd / 35
PHI
75.8
of 35
Clean Pocket Grade
CHI
78.3
22nd / 35
PHI
55.0
of 35
Pressure Grade
CHI
48.1
16th / 35
PHI
2.1%
of 35
Big Time Throw %
CHI
3.0%
25th / 35
PHI
0.0%
of 35
Turnover Worthy %
CHI
2.5%
17th / 35
PHI
2.30s
of 35
Avg Time To Throw
CHI
3.50s
35th / 35
PHI
8.4
of 35
Avg Depth of Target
CHI
5.9
35th / 35

Efficiency and Scoring

Season-to-date EPA, success rate, and scoring, with each figure's league rank.

Offense
PHICHI
-0.1330th/32
EPA / Play
+0.0314th/32
-0.1225th/32
EPA / Play (Passing)
+0.1014th/32
-0.1727th/32
EPA / Play (Rushing)
-0.0618th/32
39.4%31st/32
Success Rate
46.7%12th/32
40.1%29th/32
Success Rate (Passing)
51.7%7th/32
38.1%25th/32
Success Rate (Rushing)
40.7%16th/32
18.429th/32
Points Per Game
23.813th/32
Defense
PHICHI
+0.0826th/32
EPA / Play
-0.0312th/32
+0.1324th/32
EPA / Play (Passing)
-0.056th/32
+0.0131st/32
EPA / Play (Rushing)
-0.0128th/32
45.1%19th/32
Success Rate
42.2%4th/32
46.4%16th/32
Success Rate (Passing)
40.7%2nd/32
43.2%22nd/32
Success Rate (Rushing)
44.6%26th/32
22.414th/32
Points Per Game
19.25th/32

Pressure Matchup

Each team's O-line pressure allowed against the other team's pass rush generated.

When Philadelphia Eagles have the ball
PHI pressure allowed42.7%27th of 32
→
CHI pressure generated39.7%7th of 32
When Chicago Bears have the ball
CHI pressure allowed36.9%19th of 32
→
PHI pressure generated32.9%25th of 32

Team Grades

Both teams' own season-to-date PFF grades, side by side.

Grades ranked all 32 teams
PHI
70.2
26th / 32
Overall
CHI
75.1
15th / 32
PHI
66.7
23rd / 32
Offense
CHI
72.2
14th / 32
PHI
63.6
21st / 32
Defense
CHI
66.3
16th / 32
PHI
75.6
21st / 32
Special Teams
CHI
70.0
26th / 32
PHI
56.0
24th / 32
Passing Offense
CHI
61.1
21st / 32
PHI
82.5
5th / 32
Rushing Offense
CHI
67.1
25th / 32
PHI
66.7
25th / 32
Receiving
CHI
74.8
11th / 32
PHI
63.2
18th / 32
Offensive Line
CHI
69.8
6th / 32
PHI
64.3
29th / 32
Pass Rush
CHI
71.5
11th / 32
PHI
58.4
18th / 32
Coverage
CHI
65.9
13th / 32
PHI
64.6
13th / 32
Run Defense
CHI
53.7
28th / 32
🔒

Unlock Matchups & Betting Edge

PFF player grades, lineup matchups, and betting-line insights for every game are a free-account feature. This one's part of the paid slate — the Game of the Week is always free to view in full.

Sign Up Free