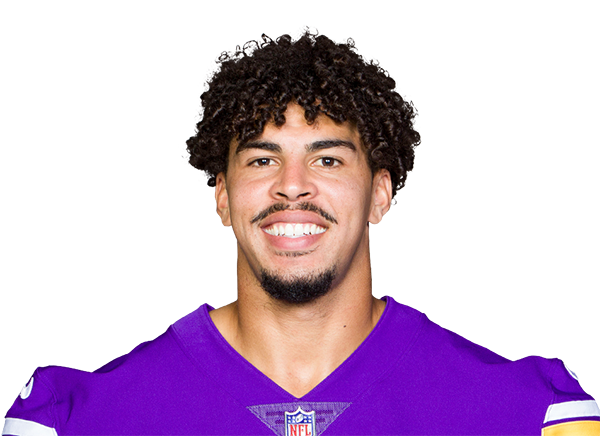
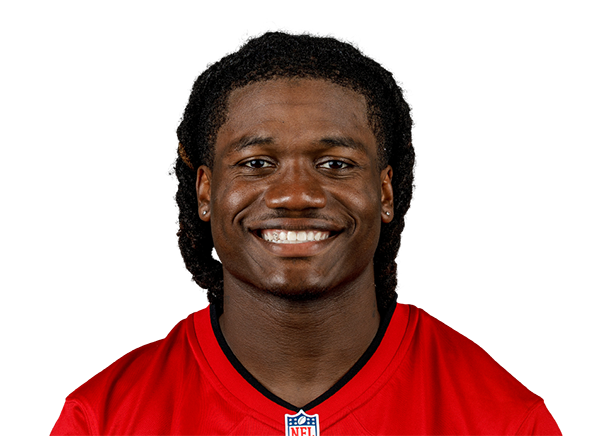
Minnesota Vikings vs Tampa Bay Buccaneers — Win Probability


Injury Report
The latest official designations and practice participation for both teams.
- PBrett ThorsonOut
- CNick SamacOut
- RBAaron JonesFull
- TBrian O'NeillFull
- RBDeeJay DallasFull
- LBJake GoldayFull
- DEJalen RedmondFull
- DETyrion Ingram-DawkinsFull
- QBBaker MayfieldFull
- LBJosiah TrotterOut
- LBRueben Bain Jr.Out
- LBAnthony NelsonFull
- CBJacob ParrishFull
- WRJalen McMillanFull
Prediction vs. Result
We keep every prediction permanently so we can always show our work.
MIN edges TB in tight matchup; model's projection off by 6 points
Minnesota's 23-16 victory over Tampa Bay played out nearly as the pregame market expected—the Vikings were favored by 1 point—but the model's simulation underestimated the final margin by a significant degree.
Before kickoff, the model projected Minnesota to win 21.8-20.8, a 1-point expected margin. That aligned closely with the published spread of MIN -1. The model gave the Vikings a 53% win probability, a modest edge in a game it saw as a toss-up.
What actually happened was a 7-point Minnesota victory, with the Vikings reaching 23 points and Tampa Bay settling at 16. The 7-point actual margin exceeded the model's 1-point projection by 6 points—a meaningful gap that suggests the simulation underestimated Minnesota's ability to separate or Tampa Bay's struggles to keep pace.
This wasn't a blown call on the winner. The model correctly identified Minnesota as the likely victor. But the magnitude of the win fell well outside the projection range. The Vikings scored 1.2 points more than expected and held Tampa Bay 4.8 points below their simulated output. That's not a narrow miss; it's the kind of discrepancy that points to either Minnesota executing significantly better than modeled or Tampa Bay underperforming its baseline.
For a game the model treated as nearly even, the actual result showed more decisive execution from one side. Minnesota improved to 3-0; Tampa Bay fell to 0-3. The model's directional call was sound, but the gap between projected and actual margin reveals that it failed to fully capture the game's true competitive balance or one team's performance ceiling.
Margin of Victory — Tampa Bay Buccaneers (Home)
Pregame odds for every possible outcome, simulated before kickoff -- the highlighted bar is what actually happened.
Total Score — Over / Under
Combined final score against five common lines, plus this game's actual market line -- the real combined score was 39.
Unlock Full Game Stats
Margin-of-victory breakdowns and total-score probabilities for every game are a free-account feature. This one's part of the paid slate — the Game of the Week is always free to view in full.
Sign Up Free