Las Vegas Raiders vs New Orleans Saints — Win Probability


Injury Report
The latest official designations and practice participation for both teams.
- STreydan StukesOut
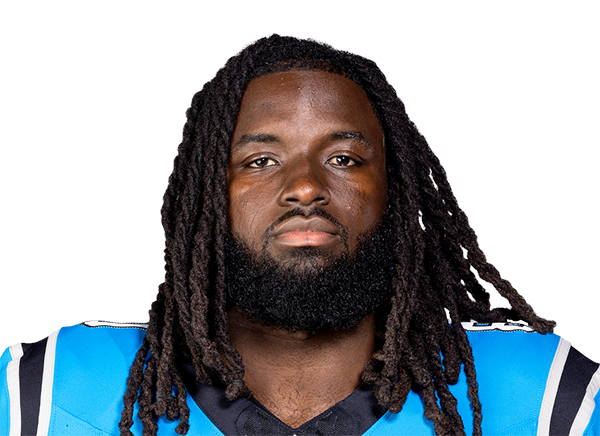
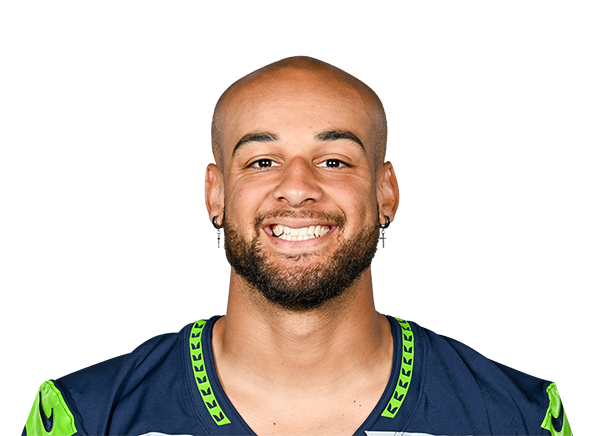
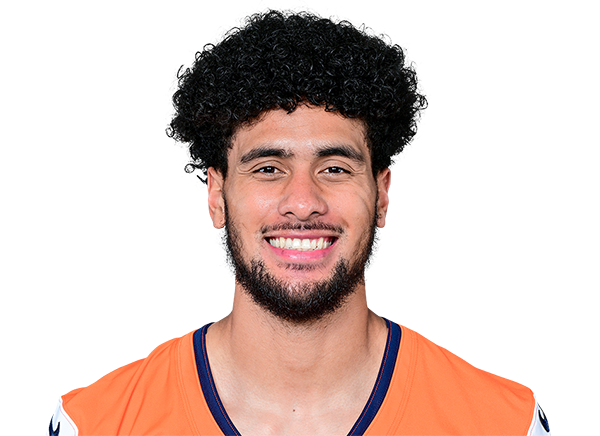
- TEBrock BowersQuestionable
- DEKwity PayeQuestionable
- WRDareke YoungFull
- CBDarien PorterFull
- DTFoley FatukasiFull
- DTJJ PeguesFull
- LBNakobe DeanFull
- LBSegun OlubiFull
- WRBarion BrownOut
- DTChristen MillerOut
- CBMartin EmersonQuestionable
- DTNathan ShepherdLimited
- LBChase YoungFull
- LBIsaiah StalbirdFull
- SJonas SankerFull
- RBKendre MillerFull
- RBTravis EtienneFull
Prediction vs. Result
We keep every prediction permanently so we can always show our work.
Las Vegas Stuns New Orleans as Model Misread Pregame Matchup
Las Vegas defeated New Orleans 35-27 in a Week 3 upset, with the Raiders winning by 8 points in a game the model projected would favor the Saints by 3.5 points. The gap between projection and result was 11.5 points—a significant miss that reflects how badly the pregame setup was misjudged.
The model assigned Las Vegas only a 40% win probability before kickoff, despite the market also favoring New Orleans at a 3.5-point spread. The model's expected final score was Saints 23.5, Raiders 20—a mirror image of the actual outcome's trajectory, yet entirely wrong in direction.
What actually happened: Las Vegas scored 35 points, 15 more than the model projected. New Orleans scored 27, slightly exceeding the model's 23.5 forecast but falling far short of what would have been needed to win. The Raiders' offensive performance was the decisive factor—they generated 75% more scoring than the model anticipated.
This was a genuine upset by both the model's and the market's standards. The betting line had New Orleans favored by the same margin the model predicted in the opposite direction, indicating consensus around a Saints victory. Las Vegas not only won but dominated the second half's scoring efficiency.
The 11.5-point swing between expected margin and actual result places this firmly in the category of substantial prediction error. The model correctly identified uncertainty (40% win probability for Las Vegas is not a confident prediction), but the direction of that uncertainty was backward. This game reflects a case where pregame evaluation systematically underestimated one team's capacity to execute on offense, a gap that closed decisively once play began.
Margin of Victory — New Orleans Saints (Home)
Pregame odds for every possible outcome, simulated before kickoff -- the highlighted bar is what actually happened.
Total Score — Over / Under
Combined final score against five common lines, plus this game's actual market line -- the real combined score was 62.
Unlock Full Game Stats
Margin-of-victory breakdowns and total-score probabilities for every game are a free-account feature. This one's part of the paid slate — the Game of the Week is always free to view in full.
Sign Up Free