LAR26
FINAL
30DEN
← back to predictions

Los Angeles Rams vs Denver Broncos — Win Probability


FINAL
Los Angeles Rams logo
Los Angeles Rams
1-1
26
VS
Denver Broncos logo
Denver Broncos
1-1
30
Market line: LAR -1.0, total 43.5 · Model expected score: Los Angeles Rams 22.2 – Denver Broncos 21.2
Ad space

Injury Report

The latest official designations and practice participation for both teams.

LAR
  • SKamren KinchensDoubtful
  • WRPuka NacuaDoubtful
  • TEColby ParkinsonQuestionable
  • LBNate LandmanLimited
  • TAlaric JacksonFull
  • WRJordan WhittingtonFull
  • SQuentin LakeFull
  • TETerrance FergusonFull
DEN
  • RBJonah ColemanOut
  • WRMarvin Mims Jr.Questionable
  • RBJ.K. DobbinsFull
  • RBRJ HarveyFull

Prediction vs. Result

We keep every prediction permanently so we can always show our work.

PREGAME WIN PROBABILITY
Rams 53%
ACTUAL RESULT
Denver Broncos won by 4
COMBINED SCORE
56

Denver Stuns LA With 30-26 Upset Win, Model Missed Pregame Read

Denver entered Sunday's matchup against Los Angeles as the underdog in both the model's pregame projection and the betting market. The market favored the Rams by 1 point, while the model gave Denver only a 47% win probability—essentially a coin flip, but with a slight lean toward LA.

The model's expected scoring told a similar story: it projected Los Angeles to outscore Denver 22.2 to 21.2, a 1-point margin in LA's favor. That matched the market consensus. Denver, however, delivered a different result.

The Broncos won 30-26, claiming a 4-point victory that qualifies as an upset by both the betting line and the model's pregame assessment. The gap between projection and reality is significant: Denver's expected margin was -1 (a 1-point loss) while the actual margin was +4 (a 4-point win). That's a 5-point swing in Denver's favor relative to the model's pregame read.

In raw score terms, Denver exceeded its expected output by 8.8 points (30 vs. 21.2 projected), while Los Angeles fell short of its projection by 4.2 points (26 vs. 22.2 expected). The Broncos' offensive performance was the primary driver of the miss.

This represents a notable miss for the model, though it falls short of a complete blowout miscalculation. The model wasn't confident in either team—the 47% win probability reflected genuine uncertainty—but it still underestimated Denver's ability to execute against LA. The Broncos' 4-point win improved their record to 2-1, while the Rams fell to 1-2, making Sunday a decisive swing game that the model failed to anticipate.

Ad space

Margin of Victory — Denver Broncos (Home)

Pregame odds for every possible outcome, simulated before kickoff -- the highlighted bar is what actually happened.

Lost / Tied
53%
Won by 1-3
9%
Won by 4-7 ← actual result
11%
Won by 8-14
14%
Won by 15-21
8%
Won by 21+
5%

Total Score — Over / Under

Combined final score against five common lines, plus this game's actual market line -- the real combined score was 56.

O/U LINE 30
84% over ✓16% under
O/U LINE 40
60% over ✓40% under
O/U LINE 43.5 MARKET LINE
50% over ✓50% under
O/U LINE 44
48% over ✓52% under
O/U LINE 48
37% over ✓63% under
O/U LINE 52
26% over ✓74% under
🔒

Unlock Full Game Stats

Margin-of-victory breakdowns and total-score probabilities for every game are a free-account feature. This one's part of the paid slate — the Game of the Week is always free to view in full.

Sign Up Free
Every number above comes from the model's live prediction data — 100,000 Monte Carlo simulations, grounded in the market line at generation time.

Ad space

Highest Graded Players

Season-to-date PFF grades for each team's top graded players, minimum 25% of that side's snaps.

LAR
Puka NacuaWR
86.6
Kyren WilliamsHB
77.9
Alaric JacksonT
76.4
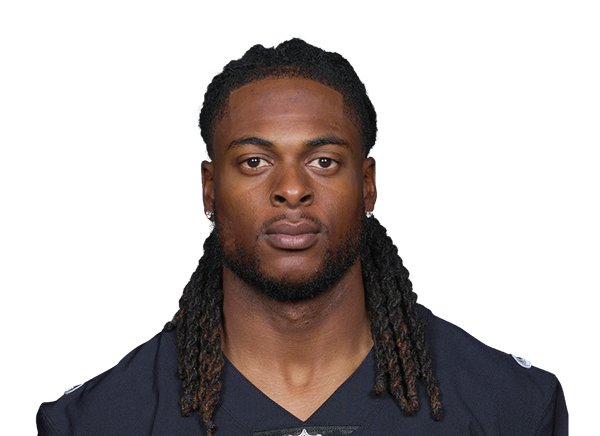
Davante AdamsWR
75.9
Coleman SheltonC
73.0
DEN
Quinn MeinerzG
87.0
Garett BollesT
81.6
Luke WattenbergC
68.0
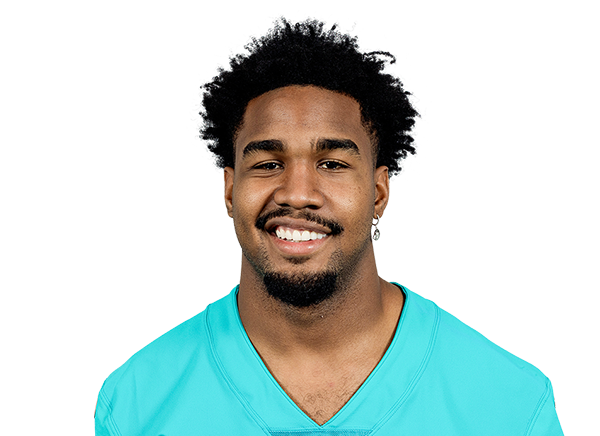
Jaylen WaddleWR
65.7
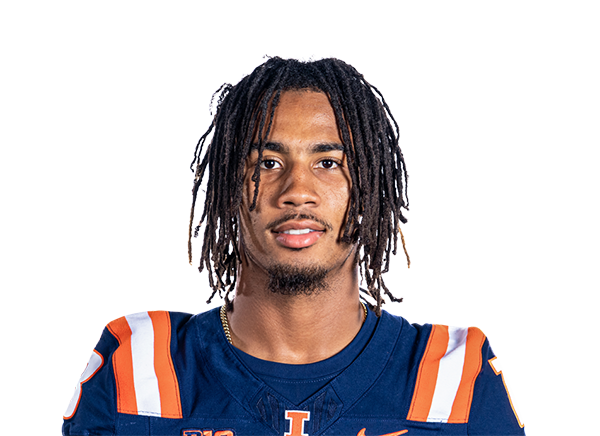
Pat BryantWR
64.8

QB Matchup

Each team's real current starting QB (per PFF's own depth chart) -- season-to-date PFF grades and passing profile, ranked against the league's other starters. A stat reads “—” when that player has no recorded snaps for it yet this season (e.g. just back from injury).

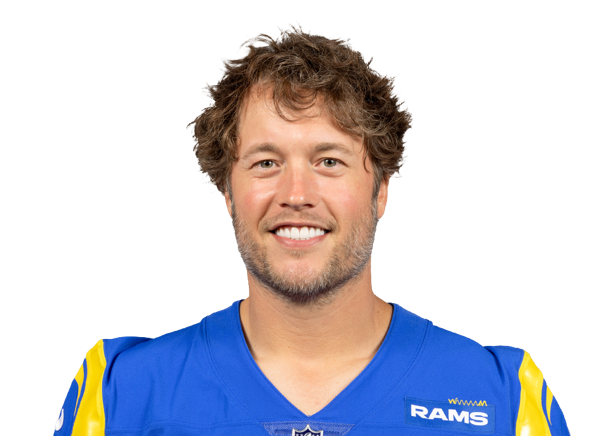
LARMatthew Stafford
VS
DENBo Nix
LAR
64.9
23rd / 35
Overall Grade
DEN
46.6
33rd / 35
LAR
78.6
21st / 35
Clean Pocket Grade
DEN
69.3
28th / 35
LAR
36.8
26th / 35
Pressure Grade
DEN
28.2
34th / 35
LAR
3.4%
21st / 35
Big Time Throw %
DEN
2.4%
29th / 35
LAR
4.2%
22nd / 35
Turnover Worthy %
DEN
5.0%
29th / 35
LAR
2.64s
6th / 35
Avg Time To Throw
DEN
2.97s
20th / 35
LAR
8.5
15th / 35
Avg Depth of Target
DEN
6.3
33rd / 35

Efficiency and Scoring

Season-to-date EPA, success rate, and scoring, with each figure's league rank.

Offense
LARDEN
+0.0710th/32
EPA / Play
-0.0926th/32
+0.1113th/32
EPA / Play (Passing)
-0.1226th/32
-0.0212th/32
EPA / Play (Rushing)
-0.0414th/32
48.0%9th/32
Success Rate
38.1%32nd/32
49.8%13th/32
Success Rate (Passing)
39.4%31st/32
44.7%10th/32
Success Rate (Rushing)
36.2%28th/32
23.813th/32
Points Per Game
19.426th/32
Defense
LARDEN
-0.0314th/32
EPA / Play
-0.0411th/32
-0.0014th/32
EPA / Play (Passing)
-0.047th/32
-0.0617th/32
EPA / Play (Rushing)
-0.0420th/32
46.2%23rd/32
Success Rate
42.8%7th/32
47.5%20th/32
Success Rate (Passing)
44.8%10th/32
44.5%25th/32
Success Rate (Rushing)
39.6%10th/32
24.020th/32
Points Per Game
22.213th/32

Pressure Matchup

Each team's O-line pressure allowed against the other team's pass rush generated.

When Los Angeles Rams have the ball
LAR pressure allowed31.6%5th of 32
→
DEN pressure generated41.6%5th of 32
When Denver Broncos have the ball
DEN pressure allowed38.9%24th of 32
→
LAR pressure generated38.5%11th of 32

Team Grades

Both teams' own season-to-date PFF grades, side by side.

Grades ranked all 32 teams
LAR
77.5
9th / 32
Overall
DEN
71.2
24th / 32
LAR
74.5
9th / 32
Offense
DEN
64.1
25th / 32
LAR
66.1
17th / 32
Defense
DEN
69.9
11th / 32
LAR
77.5
18th / 32
Special Teams
DEN
84.6
13th / 32
LAR
64.3
20th / 32
Passing Offense
DEN
54.0
26th / 32
LAR
81.4
6th / 32
Rushing Offense
DEN
67.4
24th / 32
LAR
71.8
17th / 32
Receiving
DEN
67.0
23rd / 32
LAR
71.3
1st / 32
Offensive Line
DEN
61.1
23rd / 32
LAR
70.8
12th / 32
Pass Rush
DEN
82.8
2nd / 32
LAR
69.9
9th / 32
Coverage
DEN
66.5
12th / 32
LAR
55.5
27th / 32
Run Defense
DEN
55.7
26th / 32
🔒

Unlock Matchups & Betting Edge

PFF player grades, lineup matchups, and betting-line insights for every game are a free-account feature. This one's part of the paid slate — the Game of the Week is always free to view in full.

Sign Up Free