CAR18
FINAL
21CLE
← back to predictions

Carolina Panthers vs Cleveland Browns — Win Probability


FINAL
Carolina Panthers logo
Carolina Panthers
1-1
18
VS
Cleveland Browns logo
Cleveland Browns
1-1
21
Market line: CAR -2.0, total 41.5 · Model expected score: Carolina Panthers 21.8 – Cleveland Browns 19.7
Ad space

Injury Report

The latest official designations and practice participation for both teams.

CAR
  • LBClaudin CherelusOut
  • LBDevin LloydOut
  • SNick ScottOut
  • WRJalen CokerQuestionable
  • WRXavier LegetteQuestionable
  • DTBobby Brown IIIFull
  • LBJaelan PhillipsFull
  • LBPatrick Jones IIFull
CLE
  • GTeven JenkinsOut
  • SGrant DelpitQuestionable
  • CBTyson CampbellQuestionable
  • DTMason GrahamFull
  • LBQuincy WilliamsFull
  • TTytus HowardFull

Prediction vs. Result

We keep every prediction permanently so we can always show our work.

PREGAME WIN PROBABILITY
Panthers 56%
ACTUAL RESULT
Cleveland Browns won by 3
COMBINED SCORE
39

Cleveland's 21-18 Upset Over Carolina Defied Model's 2-Point Projection

The Cleveland Browns pulled off a road upset over Carolina on Sunday, winning 21-18 in a game where the model assigned them just a 44% chance of victory pregame. Carolina entered as the market favorite with a 2-point spread, reflecting the consensus view that the Panthers were the stronger team. The model largely agreed, projecting Carolina to outscore Cleveland by 2 points (21.8 to 19.7).

What actually happened was a near-reversal. Cleveland won by 3 points instead of losing by 2—a 5-point swing from the expected margin. The actual outcome placed Cleveland on the correct side of a coin flip the model had called slightly in Carolina's favor.

This was a genuine upset by the numbers. A 44% pregame win probability means the model saw this as a toss-up with a lean toward Carolina, and Cleveland's victory contradicted that lean. However, the miss itself was modest in scope. The final score (21-18) stayed close to the model's projection of a tight game. The model predicted a 2-point Panthers win; Cleveland won by 3. That 5-point swing in margin is notable but not extreme—it reflects a game that played out differently in execution but remained competitive throughout.

The market's 2-point spread was vindicated by the closeness of the result, even though Carolina didn't cover. Cleveland's upset win suggests either superior execution in the game itself or pregame factors the model underweighted. The narrow final margin indicates this was not a dominant performance that should have been obvious beforehand, but rather a competitive game where the Browns made enough plays to flip the outcome from the model's expectation.

Ad space

Margin of Victory — Cleveland Browns (Home)

Pregame odds for every possible outcome, simulated before kickoff -- the highlighted bar is what actually happened.

Lost / Tied
56%
Won by 1-3 ← actual result
9%
Won by 4-7
10%
Won by 8-14
13%
Won by 15-21
7%
Won by 21+
4%

Total Score — Over / Under

Combined final score against five common lines, plus this game's actual market line -- the real combined score was 39.

O/U LINE 30
81% over ✓19% under
O/U LINE 40
54% over46% under ✓
O/U LINE 41.5 MARKET LINE
50% over50% under ✓
O/U LINE 44
42% over58% under ✓
O/U LINE 48
31% over69% under ✓
O/U LINE 52
21% over79% under ✓
🔒

Unlock Full Game Stats

Margin-of-victory breakdowns and total-score probabilities for every game are a free-account feature. This one's part of the paid slate — the Game of the Week is always free to view in full.

Sign Up Free
Every number above comes from the model's live prediction data — 100,000 Monte Carlo simulations, grounded in the market line at generation time.

Ad space

Highest Graded Players

Season-to-date PFF grades for each team's top graded players, minimum 25% of that side's snaps.

CAR
Bryce YoungQB
85.2
Chuba HubbardHB
82.9
Tetairoa McMillanWR
80.4
Damien LewisG
78.1
Jalen CokerWR
75.0
CLE
Denzel BostonWR
73.7
Austin BarberG
71.5
Zion JohnsonG
69.7
Spencer FanoT
69.2
KC ConcepcionWR
64.7

QB Matchup

Each team's real current starting QB (per PFF's own depth chart) -- season-to-date PFF grades and passing profile, ranked against the league's other starters. A stat reads “—” when that player has no recorded snaps for it yet this season (e.g. just back from injury).

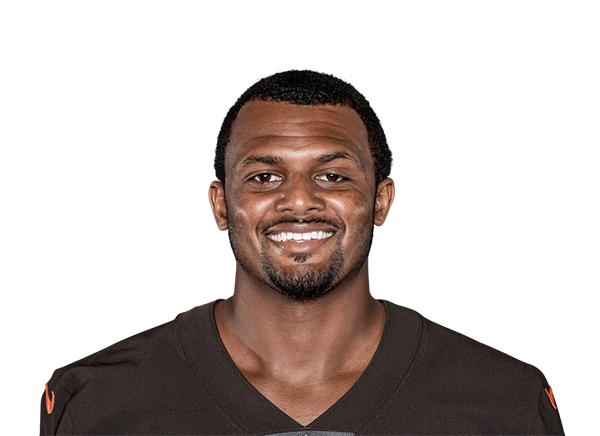
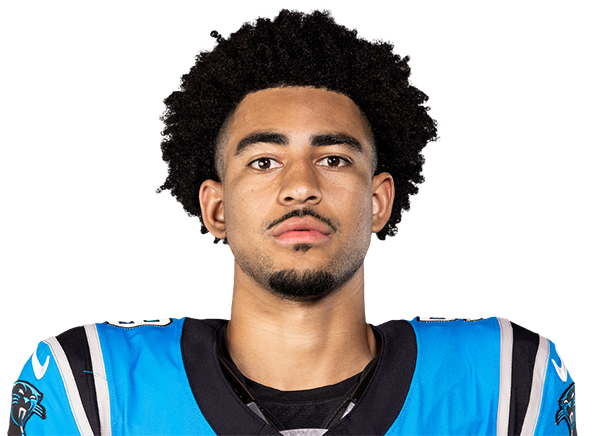
CARBryce Young
VS
CLEDeshaun Watson
CAR
85.2
6th / 35
Overall Grade
CLE
53.0
29th / 35
CAR
91.4
4th / 35
Clean Pocket Grade
CLE
71.4
27th / 35
CAR
62.3
6th / 35
Pressure Grade
CLE
32.7
29th / 35
CAR
4.2%
11th / 35
Big Time Throw %
CLE
3.2%
23rd / 35
CAR
0.9%
3rd / 35
Turnover Worthy %
CLE
4.6%
26th / 35
CAR
2.85s
17th / 35
Avg Time To Throw
CLE
3.09s
25th / 35
CAR
10.0
5th / 35
Avg Depth of Target
CLE
7.7
24th / 35

Efficiency and Scoring

Season-to-date EPA, success rate, and scoring, with each figure's league rank.

Offense
CARCLE
+0.136th/32
EPA / Play
-0.1028th/32
+0.196th/32
EPA / Play (Passing)
-0.0222nd/32
+0.017th/32
EPA / Play (Rushing)
-0.2531st/32
45.0%15th/32
Success Rate
39.5%30th/32
45.0%19th/32
Success Rate (Passing)
43.9%22nd/32
45.1%6th/32
Success Rate (Rushing)
32.1%32nd/32
30.34th/32
Points Per Game
18.627th/32
Defense
CARCLE
-0.0118th/32
EPA / Play
-0.0410th/32
+0.0015th/32
EPA / Play (Passing)
-0.0310th/32
-0.0225th/32
EPA / Play (Rushing)
-0.0616th/32
43.2%8th/32
Success Rate
42.5%5th/32
45.2%11th/32
Success Rate (Passing)
43.0%4th/32
39.3%9th/32
Success Rate (Rushing)
41.7%18th/32
27.326th/32
Points Per Game
22.414th/32

Pressure Matchup

Each team's O-line pressure allowed against the other team's pass rush generated.

When Carolina Panthers have the ball
CAR pressure allowed44.5%30th of 32
→
CLE pressure generated41.7%4th of 32
When Cleveland Browns have the ball
CLE pressure allowed43.0%29th of 32
→
CAR pressure generated39.4%8th of 32

Team Grades

Both teams' own season-to-date PFF grades, side by side.

Grades ranked all 32 teams
CAR
80.8
3rd / 32
Overall
CLE
68.2
27th / 32
CAR
78.6
4th / 32
Offense
CLE
63.7
26th / 32
CAR
63.9
20th / 32
Defense
CLE
64.9
18th / 32
CAR
87.1
9th / 32
Special Teams
CLE
75.7
19th / 32
CAR
81.7
4th / 32
Passing Offense
CLE
55.6
25th / 32
CAR
78.6
10th / 32
Rushing Offense
CLE
60.5
29th / 32
CAR
77.5
3rd / 32
Receiving
CLE
70.5
20th / 32
CAR
66.2
11th / 32
Offensive Line
CLE
62.4
20th / 32
CAR
71.8
9th / 32
Pass Rush
CLE
66.6
25th / 32
CAR
64.2
15th / 32
Coverage
CLE
65.5
14th / 32
CAR
52.2
30th / 32
Run Defense
CLE
61.4
15th / 32
🔒

Unlock Matchups & Betting Edge

PFF player grades, lineup matchups, and betting-line insights for every game are a free-account feature. This one's part of the paid slate — the Game of the Week is always free to view in full.

Sign Up Free