WAS20
FINAL
37DAL
← back to predictions

Washington Commanders vs Dallas Cowboys — Win Probability


FINAL
Washington Commanders logo
Washington Commanders
0-1
20
VS
Dallas Cowboys logo
Dallas Cowboys
0-1
37
Market line: DAL -4.0, total 50.5 · Model expected score: Washington Commanders 23.3 – Dallas Cowboys 27.2
Ad space

Injury Report

The latest official designations and practice participation for both teams.

WAS
  • TEChig OkonkwoOut
  • LBFrankie LuvuOut
  • DTJavon KinlawQuestionable
  • DECharles OmenihuLimited
  • LBDorance ArmstrongLimited
  • WRJaylin LaneLimited
  • LBK'Lavon ChaissonLimited
  • LBOdafe OwehLimited
  • GChris PaulFull
  • DTDaron PayneFull
  • RBKaytron AllenFull
  • STyler OwensFull
DAL
  • LBDeMarvion OvershownOut
  • SMalik HookerOut
  • TAjani CorneliusFull
  • LBJames HoustonFull

Prediction vs. Result

We keep every prediction permanently so we can always show our work.

PREGAME WIN PROBABILITY
Cowboys 62%
ACTUAL RESULT
Dallas Cowboys won by 17
COMBINED SCORE
57

Dallas dominates projection in 37-20 rout of Washington

The model called Dallas to win, but not like this. Before kickoff, the projection system gave the Cowboys a 62% win probability with an expected final score of 27.2–23.3—a margin of just 3.9 points. The market line of Dallas minus-4 was actually wider than the model's own expected margin, suggesting the betting public saw a slightly more decisive outcome than the simulation did.

What happened on the field was a far more comfortable victory. Dallas won 37–20, a 17-point margin that more than quadrupled the projected spread. The Cowboys' actual score (37) exceeded the projection by nearly 10 points, while Washington's output (20) fell 3.3 points short of the expected 23.3.

This represents a significant miss in both the magnitude and nature of the game. The model nailed the winner but substantially underestimated Dallas's dominance. A 3.9-point spread projection that became a 17-point blowout is a gap of 13.1 points—the kind of error that suggests the pregame read on team strength, tempo, or execution was materially off.

The accuracy on win probability (62% for the eventual winner) held up, since Dallas did win. But for a model whose brand depends on precise margin projection, missing by 13 points is a clear miscalibration of how much better Dallas would perform. The Cowboys' performance exceeded both the projection and the market line in the same direction, indicating neither model nor market fully captured Dallas's edge heading into the game.

This was a miss dressed as a hit—correct pick, wrong confidence level and wrong expected result.

Ad space

Margin of Victory — Dallas Cowboys (Home)

Pregame odds for every possible outcome, simulated before kickoff -- the highlighted bar is what actually happened.

Lost / Tied
38%
Won by 1-3
9%
Won by 4-7
12%
Won by 8-14
19%
Won by 15-21 ← actual result
13%
Won by 21+
10%

Total Score — Over / Under

Combined final score against five common lines, plus this game's actual market line -- the real combined score was 57.

O/U LINE 30
94% over ✓6% under
O/U LINE 40
78% over ✓22% under
O/U LINE 44
69% over ✓31% under
O/U LINE 48
57% over ✓43% under
O/U LINE 50.5 MARKET LINE
50% over ✓50% under
O/U LINE 52
45% over ✓55% under
🔒

Unlock Full Game Stats

Margin-of-victory breakdowns and total-score probabilities for every game are a free-account feature. This one's part of the paid slate — the Game of the Week is always free to view in full.

Sign Up Free
Every number above comes from the model's live prediction data — 100,000 Monte Carlo simulations, grounded in the market line at generation time.

Ad space

Highest Graded Players

Season-to-date PFF grades for each team's top graded players, minimum 25% of that side's snaps.

WAS
Sam CosmiG
80.8
Jayden DanielsQB
77.3
Antonio WilliamsWR
72.7
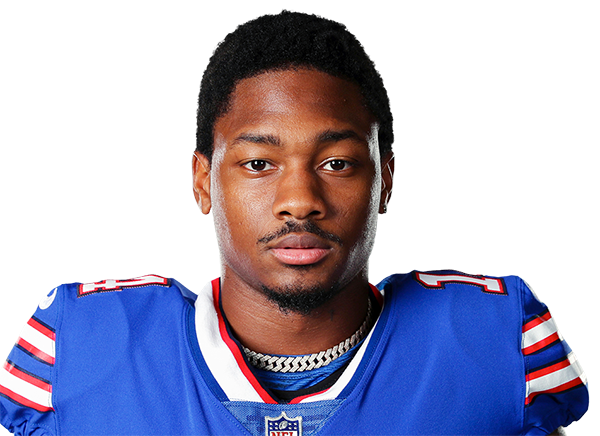
Stefon DiggsWR
66.8
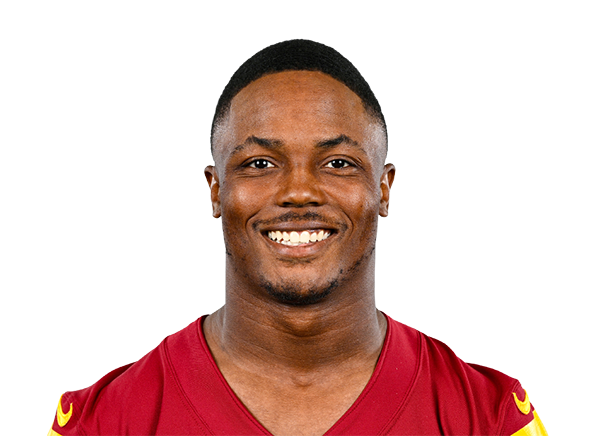
Terry McLaurinWR
66.7
DAL
CeeDee LambWR
88.6
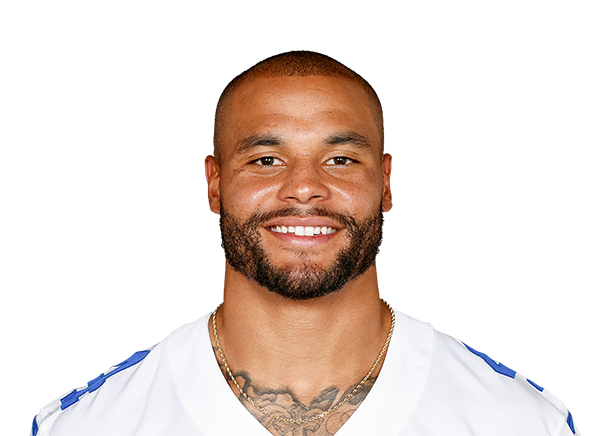
Dak PrescottQB
83.2
Tyler BookerG
76.0
Tyler SmithG
75.6
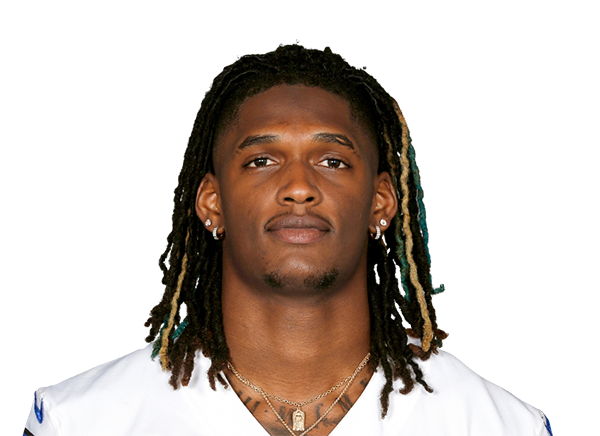
George PickensWR
74.6

QB Matchup

Each team's real current starting QB (per PFF's own depth chart) -- season-to-date PFF grades and passing profile, ranked against the league's other starters. A stat reads “—” when that player has no recorded snaps for it yet this season (e.g. just back from injury).

WASJayden Daniels
VS
DALDak Prescott
WAS
77.3
12th / 35
Overall Grade
DAL
83.2
8th / 35
WAS
84.8
15th / 35
Clean Pocket Grade
DAL
92.4
2nd / 35
WAS
34.9
28th / 35
Pressure Grade
DAL
51.0
12th / 35
WAS
1.2%
34th / 35
Big Time Throw %
DAL
3.4%
21st / 35
WAS
1.0%
4th / 35
Turnover Worthy %
DAL
2.4%
13th / 35
WAS
3.16s
30th / 35
Avg Time To Throw
DAL
2.75s
12th / 35
WAS
9.2
8th / 35
Avg Depth of Target
DAL
7.8
22nd / 35

Efficiency and Scoring

Season-to-date EPA, success rate, and scoring, with each figure's league rank.

Offense
WASDAL
+0.0015th/32
EPA / Play
+0.098th/32
+0.0916th/32
EPA / Play (Passing)
+0.1212th/32
-0.1222nd/32
EPA / Play (Rushing)
+0.018th/32
40.6%25th/32
Success Rate
50.9%3rd/32
44.6%20th/32
Success Rate (Passing)
52.5%5th/32
34.6%30th/32
Success Rate (Rushing)
47.3%4th/32
23.017th/32
Points Per Game
27.67th/32
Defense
WASDAL
+0.0523rd/32
EPA / Play
+0.1832nd/32
+0.1726th/32
EPA / Play (Passing)
+0.3732nd/32
-0.191st/32
EPA / Play (Rushing)
-0.0419th/32
47.7%27th/32
Success Rate
49.5%30th/32
51.9%27th/32
Success Rate (Passing)
56.5%31st/32
39.3%8th/32
Success Rate (Rushing)
40.9%15th/32
29.830th/32
Points Per Game
27.225th/32

Pressure Matchup

Each team's O-line pressure allowed against the other team's pass rush generated.

When Washington Commanders have the ball
WAS pressure allowed38.3%22nd of 32
→
DAL pressure generated34.3%22nd of 32
When Dallas Cowboys have the ball
DAL pressure allowed34.3%14th of 32
→
WAS pressure generated33.6%24th of 32

Team Grades

Both teams' own season-to-date PFF grades, side by side.

Grades ranked all 32 teams
WAS
63.7
30th / 32
Overall
DAL
73.0
20th / 32
WAS
65.3
24th / 32
Offense
DAL
78.4
5th / 32
WAS
58.7
28th / 32
Defense
DAL
51.8
31st / 32
WAS
72.6
23rd / 32
Special Teams
DAL
66.3
28th / 32
WAS
68.4
18th / 32
Passing Offense
DAL
85.3
2nd / 32
WAS
73.9
14th / 32
Rushing Offense
DAL
68.3
20th / 32
WAS
65.7
27th / 32
Receiving
DAL
76.6
9th / 32
WAS
57.9
28th / 32
Offensive Line
DAL
64.1
15th / 32
WAS
61.9
30th / 32
Pass Rush
DAL
67.9
21st / 32
WAS
52.8
23rd / 32
Coverage
DAL
42.8
30th / 32
WAS
59.6
21st / 32
Run Defense
DAL
50.8
32nd / 32
🔒

Unlock Matchups & Betting Edge

PFF player grades, lineup matchups, and betting-line insights for every game are a free-account feature. This one's part of the paid slate — the Game of the Week is always free to view in full.

Sign Up Free