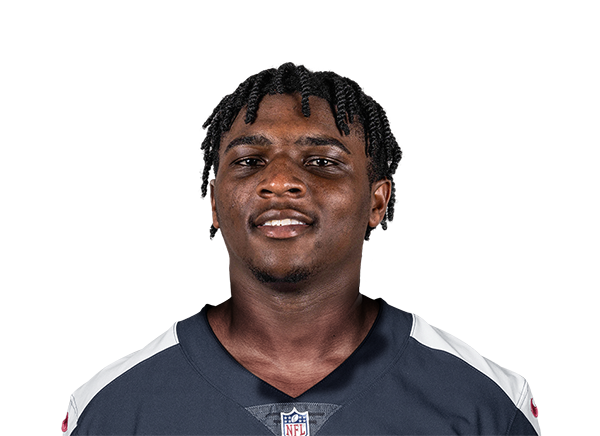
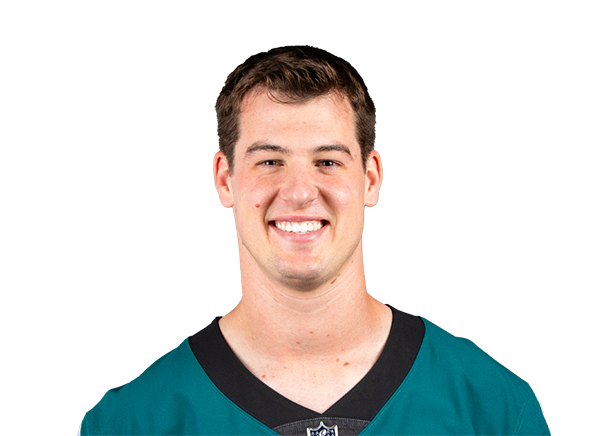
PHI24
FINAL
20TEN
← back to predictions

Philadelphia Eagles vs Tennessee Titans — Win Probability

FINAL
Philadelphia Eagles logo
Philadelphia Eagles
1-0
24
VS
Tennessee Titans logo
Tennessee Titans
0-1
20
Market line: PHI -7.0, total 39.5 · Model expected score: Philadelphia Eagles 23.2 – Tennessee Titans 16.3
Ad space

Injury Report

The latest official designations and practice participation for both teams.

PHI
  • LBJonathan GreenardOut
  • SAndrew MukubaQuestionable
  • DTJalen CarterLimited
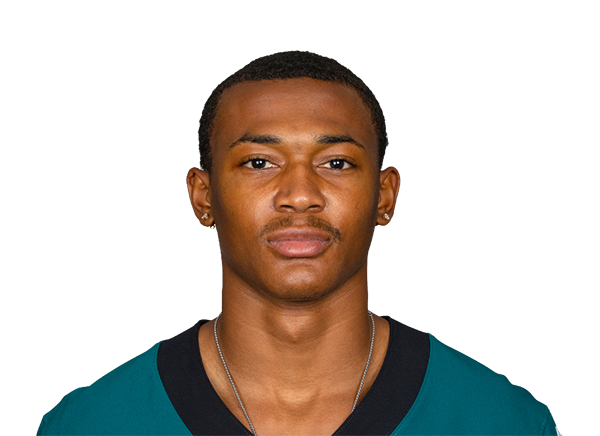
  • CBCooper DeJeanFull
  • WRElijah MooreFull
  • WRMarquise BrownFull
TEN
  • LBCedric GrayQuestionable
  • CBCordale FlottQuestionable
  • LBJames WilliamsQuestionable

Prediction vs. Result

We keep every prediction permanently so we can always show our work.

PREGAME WIN PROBABILITY
Eagles 70%
ACTUAL RESULT
Philadelphia Eagles won by 4
COMBINED SCORE
44

Eagles' 4-point win narrower than model projected in Week 2 over Titans

Philadelphia's 24-20 victory over Tennessee was a close call that fell short of the model's pregame expectations, though not by a dramatic margin.

Before kickoff, the model projected the Eagles would win by 6.9 points, with an expected final score of 23.2-16.3. The market agreed on Philadelphia as the favorite, setting a 7-point spread that aligned closely with the model's projection.

The Eagles did win as expected, but the actual margin—4 points—was 2.9 points smaller than projected. Philadelphia scored 24 points, which matched the model's forecast almost exactly. Tennessee, however, scored 20 instead of the projected 16.3, a difference of 3.7 points. The Titans' outperformance on offense was the primary driver of the tighter-than-expected result.

The model assigned Philadelphia a 70% win probability heading into the game, and the Eagles delivered on that expectation by securing the win. The outcome was not an upset—Philadelphia was the clear favorite and won—but the margin compression suggests the model may have slightly overestimated the Eagles' ability to pull away, or underestimated Tennessee's offensive capacity in this particular matchup.

For a game where the favorite wins, a 2.9-point miss on margin is a modest deviation. The model correctly identified the winner and the general competitive range. The 4-point final result fell within a reasonable range of the 6.9-point projection, indicating the model read the matchup's overall competitive balance reasonably well, even if it overstated the Eagles' margin of control. Philadelphia improved to 2-0; Tennessee fell to 0-2.

Ad space

Margin of Victory — Tennessee Titans (Home)

Pregame odds for every possible outcome, simulated before kickoff -- the highlighted bar is what actually happened.

Lost / Tied ← actual result
70%
Won by 1-3
7%
Won by 4-7
8%
Won by 8-14
9%
Won by 15-21
4%
Won by 21+
2%

Total Score — Over / Under

Combined final score against five common lines, plus this game's actual market line -- the real combined score was 44.

O/U LINE 30
76% over ✓24% under
O/U LINE 39.5 MARKET LINE
50% over ✓50% under
O/U LINE 40
48% over ✓52% under
O/U LINE 44
37% over63% under ✓
O/U LINE 48
26% over74% under ✓
O/U LINE 52
17% over83% under ✓
🔒

Unlock Full Game Stats

Margin-of-victory breakdowns and total-score probabilities for every game are a free-account feature. This one's part of the paid slate — the Game of the Week is always free to view in full.

Sign Up Free

Every number above comes from the model's live prediction data — 100,000 Monte Carlo simulations, grounded in the market line at generation time.

Ad space

Highest Graded Players

Season-to-date PFF grades for each team's top graded players, minimum 25% of that side's snaps.

PHI
DeVonta SmithWR
90.5
Jordan MailataT
80.6
Lane JohnsonT
79.8
Dallas GoedertTE
76.2
Dontayvion WicksWR
68.9
TEN
Tony PollardHB
73.0
Wan'Dale RobinsonWR
70.0
JC LathamT
69.9
Carnell TateWR
68.1
Cam WardQB
65.6

QB Matchup

Each team's real current starting QB (per PFF's own depth chart) -- season-to-date PFF grades and passing profile, ranked against the league's other starters. A stat reads “—” when that player has no recorded snaps for it yet this season (e.g. just back from injury).

PHITanner McKee
VS
TENCam Ward
PHI
70.9
of 35
Overall Grade
TEN
65.6
20th / 35
PHI
75.8
of 35
Clean Pocket Grade
TEN
72.4
24th / 35
PHI
55.0
of 35
Pressure Grade
TEN
53.1
9th / 35
PHI
2.1%
of 35
Big Time Throw %
TEN
1.6%
31st / 35
PHI
0.0%
of 35
Turnover Worthy %
TEN
2.8%
19th / 35
PHI
2.30s
of 35
Avg Time To Throw
TEN
2.96s
18th / 35
PHI
8.4
of 35
Avg Depth of Target
TEN
7.2
28th / 35

Efficiency and Scoring

Season-to-date EPA, success rate, and scoring, with each figure's league rank.

Offense
PHITEN
-0.1330th/32
EPA / Play
-0.1431st/32
-0.1225th/32
EPA / Play (Passing)
-0.1730th/32
-0.1727th/32
EPA / Play (Rushing)
-0.1020th/32
39.4%31st/32
Success Rate
40.9%24th/32
40.1%29th/32
Success Rate (Passing)
41.2%26th/32
38.1%25th/32
Success Rate (Rushing)
40.3%19th/32
18.429th/32
Points Per Game
11.632nd/32
Defense
PHITEN
+0.0826th/32
EPA / Play
+0.0422nd/32
+0.1324th/32
EPA / Play (Passing)
+0.1425th/32
+0.0131st/32
EPA / Play (Rushing)
-0.0814th/32
45.1%19th/32
Success Rate
45.3%20th/32
46.4%16th/32
Success Rate (Passing)
50.0%25th/32
43.2%22nd/32
Success Rate (Rushing)
39.7%11th/32
22.414th/32
Points Per Game
21.810th/32

Pressure Matchup

Each team's O-line pressure allowed against the other team's pass rush generated.

When Philadelphia Eagles have the ball
PHI pressure allowed42.7%27th of 32
→
TEN pressure generated29.6%28th of 32
When Tennessee Titans have the ball
TEN pressure allowed32.7%9th of 32
→
PHI pressure generated32.9%25th of 32

Team Grades

Both teams' own season-to-date PFF grades, side by side.

Grades ranked all 32 teams
PHI
70.2
26th / 32
Overall
TEN
63.0
31st / 32
PHI
66.7
23rd / 32
Offense
TEN
61.6
29th / 32
PHI
63.6
21st / 32
Defense
TEN
61.0
25th / 32
PHI
75.6
21st / 32
Special Teams
TEN
70.4
25th / 32
PHI
56.0
24th / 32
Passing Offense
TEN
53.8
27th / 32
PHI
82.5
5th / 32
Rushing Offense
TEN
71.5
18th / 32
PHI
66.7
25th / 32
Receiving
TEN
59.8
31st / 32
PHI
63.2
18th / 32
Offensive Line
TEN
64.2
14th / 32
PHI
64.3
29th / 32
Pass Rush
TEN
61.6
31st / 32
PHI
58.4
18th / 32
Coverage
TEN
52.1
24th / 32
PHI
64.6
13th / 32
Run Defense
TEN
65.9
9th / 32
🔒

Unlock Matchups & Betting Edge

PFF player grades, lineup matchups, and betting-line insights for every game are a free-account feature. This one's part of the paid slate — the Game of the Week is always free to view in full.

Sign Up Free