IND30
FINAL
33KC
← back to predictions

Indianapolis Colts vs Kansas City Chiefs — Win Probability


FINAL
Indianapolis Colts logo
Indianapolis Colts
0-1
30
VS
Kansas City Chiefs logo
Kansas City Chiefs
1-0
33
Market line: KC -5.8, total 46.5 · Model expected score: Indianapolis Colts 20.4 – Kansas City Chiefs 26.1
Ad space

Injury Report

The latest official designations and practice participation for both teams.

IND
  • QBAnthony RichardsonFull
  • WRAshton DulinOut
  • RBDJ GiddensQuestionable
  • DTDeForest BucknerDNP
  • LBAkeem Davis-GaitherFull
  • WRAlec PierceFull
  • LBAustin AjiakeFull
  • CBSauce GardnerFull
KC
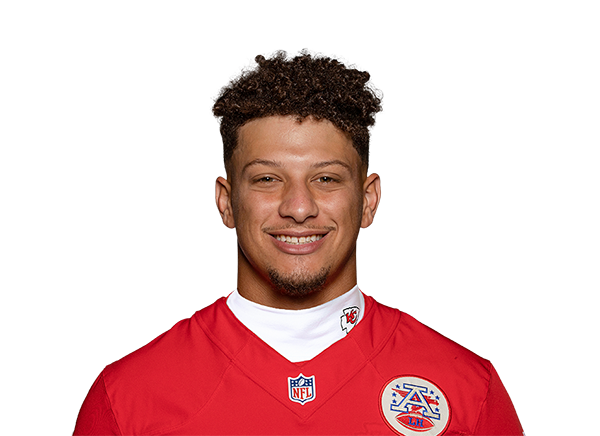
  • QBPatrick MahomesFull
  • SChamarri ConnerOut
  • TJosh SimmonsOut
  • DTChris JonesQuestionable
  • CBMansoor DelaneQuestionable
  • DEAshton GillotteFull
  • CBL'Jarius SneedFull
  • DER Mason ThomasFull
  • WRRashee RiceFull

Prediction vs. Result

We keep every prediction permanently so we can always show our work.

PREGAME WIN PROBABILITY
Chiefs 67%
ACTUAL RESULT
Kansas City Chiefs won by 3
COMBINED SCORE
63

KC's Close Call: Model Projected 5.7-Point Win, Got 3 Instead

Kansas City's 33-30 victory over Indianapolis on Sunday was the outcome the model expected—a Chiefs win with 67% win probability pregame—but the margin fell short of the projection by 2.7 points.

The model simulated a Kansas City win by 5.7 points, with the Chiefs scoring 26.1 and Indianapolis 20.4. The market's betting line was nearly identical, setting KC as a 5.8-point favorite. Both projection and line aligned closely, suggesting a confident read on Kansas City's edge.

What actually happened: Kansas City won 33-30, a 3-point margin. The Chiefs scored 6.9 points above their expected output; Indianapolis scored 9.6 points above theirs. That combination compressed the gap between the teams from the projected 5.7 points down to 3.

This was not an upset. The model got the winner right and the direction right. The 2.7-point miss in margin is modest relative to the volatility inherent in football simulation. Kansas City's expected score was conservative relative to their actual output, while Indianapolis performed significantly better than the model anticipated.

The model's 67% win probability for Kansas City proved sound—it assigned them favorites' odds and they won. The spread miss (5.8 market vs. 3 actual) reflects how both the model and the betting market slightly underestimated Indianapolis's ability to stay close, but not by a degree that would trigger significant model recalibration. Kansas City improved to 2-0; Indianapolis fell to 0-2.

Ad space

Margin of Victory — Kansas City Chiefs (Home)

Pregame odds for every possible outcome, simulated before kickoff -- the highlighted bar is what actually happened.

Lost / Tied
33%
Won by 1-3 ← actual result
8%
Won by 4-7
12%
Won by 8-14
19%
Won by 15-21
14%
Won by 21+
13%

Total Score — Over / Under

Combined final score against five common lines, plus this game's actual market line -- the real combined score was 63.

O/U LINE 30
89% over ✓11% under
O/U LINE 40
69% over ✓31% under
O/U LINE 44
57% over ✓43% under
O/U LINE 46.5 MARKET LINE
50% over ✓50% under
O/U LINE 48
45% over ✓55% under
O/U LINE 52
34% over ✓66% under
🔒

Unlock Full Game Stats

Margin-of-victory breakdowns and total-score probabilities for every game are a free-account feature. This one's part of the paid slate — the Game of the Week is always free to view in full.

Sign Up Free
Every number above comes from the model's live prediction data — 100,000 Monte Carlo simulations, grounded in the market line at generation time.

Ad space

Highest Graded Players

Season-to-date PFF grades for each team's top graded players, minimum 25% of that side's snaps.

IND
Quenton NelsonG
89.2
Matt GoncalvesG
75.8
Bernhard RaimannT
74.5
Tyler WarrenTE
73.1
Josh DownsWR
72.0
KC
Kenneth Walker IIIHB
90.8
Patrick MahomesQB
85.0
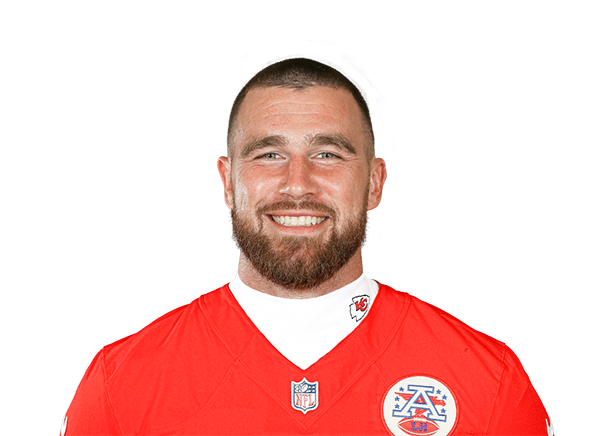
Travis KelceTE
82.1
Trey SmithG
80.4
Tyquan ThorntonWR
71.4

QB Matchup

Each team's real current starting QB (per PFF's own depth chart) -- season-to-date PFF grades and passing profile, ranked against the league's other starters. A stat reads “—” when that player has no recorded snaps for it yet this season (e.g. just back from injury).

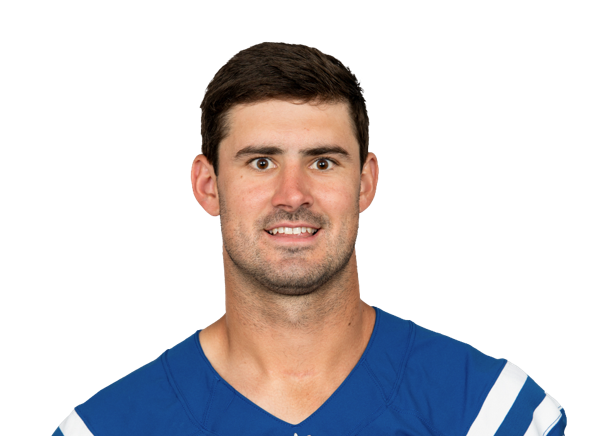
INDDaniel Jones
VS
KCPatrick Mahomes
IND
51.4
31st / 35
Overall Grade
KC
85.0
7th / 35
IND
60.6
31st / 35
Clean Pocket Grade
KC
88.8
8th / 35
IND
36.1
27th / 35
Pressure Grade
KC
62.8
5th / 35
IND
2.7%
28th / 35
Big Time Throw %
KC
6.0%
3rd / 35
IND
6.0%
35th / 35
Turnover Worthy %
KC
1.6%
6th / 35
IND
2.77s
14th / 35
Avg Time To Throw
KC
2.65s
7th / 35
IND
8.4
17th / 35
Avg Depth of Target
KC
7.0
29th / 35

Efficiency and Scoring

Season-to-date EPA, success rate, and scoring, with each figure's league rank.

Offense
INDKC
-0.0522nd/32
EPA / Play
+0.145th/32
-0.1227th/32
EPA / Play (Passing)
+0.188th/32
+0.073rd/32
EPA / Play (Rushing)
+0.081st/32
43.0%20th/32
Success Rate
49.2%7th/32
42.3%25th/32
Success Rate (Passing)
52.6%4th/32
44.0%12th/32
Success Rate (Rushing)
44.8%8th/32
24.811th/32
Points Per Game
29.55th/32
Defense
INDKC
+0.0724th/32
EPA / Play
-0.113rd/32
+0.1223rd/32
EPA / Play (Passing)
-0.123rd/32
-0.0029th/32
EPA / Play (Rushing)
-0.0910th/32
45.3%21st/32
Success Rate
39.3%2nd/32
46.7%17th/32
Success Rate (Passing)
42.4%3rd/32
43.4%23rd/32
Success Rate (Rushing)
33.9%2nd/32
27.627th/32
Points Per Game
19.37th/32

Pressure Matchup

Each team's O-line pressure allowed against the other team's pass rush generated.

When Indianapolis Colts have the ball
IND pressure allowed36.9%19th of 32
→
KC pressure generated38.4%12th of 32
When Kansas City Chiefs have the ball
KC pressure allowed33.1%10th of 32
→
IND pressure generated28.6%29th of 32

Team Grades

Both teams' own season-to-date PFF grades, side by side.

Grades ranked all 32 teams
IND
72.5
21st / 32
Overall
KC
80.6
4th / 32
IND
69.3
21st / 32
Offense
KC
78.1
6th / 32
IND
60.0
27th / 32
Defense
KC
67.3
14th / 32
IND
84.2
14th / 32
Special Teams
KC
66.6
27th / 32
IND
48.6
30th / 32
Passing Offense
KC
78.1
7th / 32
IND
68.1
21st / 32
Rushing Offense
KC
85.3
1st / 32
IND
71.0
19th / 32
Receiving
KC
72.3
15th / 32
IND
71.0
2nd / 32
Offensive Line
KC
69.7
7th / 32
IND
69.9
14th / 32
Pass Rush
KC
71.6
10th / 32
IND
46.3
28th / 32
Coverage
KC
62.7
16th / 32
IND
60.3
20th / 32
Run Defense
KC
65.2
12th / 32
🔒

Unlock Matchups & Betting Edge

PFF player grades, lineup matchups, and betting-line insights for every game are a free-account feature. This one's part of the paid slate — the Game of the Week is always free to view in full.

Sign Up Free