WAS22
FINAL
24PHI
← back to predictions

Washington Commanders vs Philadelphia Eagles — Win Probability


FINAL
Washington Commanders logo
Washington Commanders
0-0
22
VS
Philadelphia Eagles logo
Philadelphia Eagles
0-0
24
Market line: PHI -5.5, total 44.5 · Model expected score: Washington Commanders 19.5 – Philadelphia Eagles 25.0
Ad space

Injury Report

The latest official designations and practice participation for both teams.

WAS
  • QBMarcus MariotaFull
  • DTDaron PayneLimited
  • RBJacory Croskey-MerrittLimited
  • LBK'Lavon ChaissonLimited
  • LBOdafe OwehLimited
  • TEBen SinnottFull
  • DECharles OmenihuFull
  • DTJavon KinlawFull
  • LBJordan MageeFull
  • CNick AllegrettiFull
PHI
  • TEEli StowersOut
  • LBJonathan GreenardOut

Prediction vs. Result

We keep every prediction permanently so we can always show our work.

PREGAME WIN PROBABILITY
Eagles 66%
ACTUAL RESULT
Philadelphia Eagles won by 2
COMBINED SCORE
46

Model's 5.4-Point Edge Proved Accurate as Philadelphia Edges Washington

Philadelphia's 24-22 victory over Washington validated the pregame model projection, though the actual margin of victory fell short of the forecast by 3.4 points.

The model projected a Philadelphia win with a 66% probability entering the game, aligned closely with the market's 5.5-point spread favoring the Eagles. Philadelphia's expected score of 25 compared to Washington's 19.5 created a forecast margin of 5.4 points—almost exactly matching the betting line's assessment of the matchup.

What actually happened fell in line with the model's directional read but undershooted the projected point differential. Philadelphia won as expected, but by only 2 points rather than the forecasted 5.4. The Eagles scored one point below their simulation (24 vs. 25), while Washington exceeded expectations significantly, putting up 22 instead of the projected 19.5—a 2.5-point outperformance for the losing team.

This outcome represents neither a model failure nor a major surprise. The model correctly identified Philadelphia as the superior team with roughly two-to-one odds on victory, and the Eagles delivered that result. The gap between the 5.4-point projection and the 2-point actual margin—3.4 points—falls within a reasonable range for single-game variance in football. The projected winner won by a smaller margin than simulated, but the fundamental read on team quality and game direction proved sound.

The margin compression came primarily from Washington's offense exceeding its model expectation rather than Philadelphia underperforming. This tighter-than-projected outcome doesn't signal a fundamental model miscalibration; it reflects the inherent volatility of weekly NFL results. The Eagles' victory confirms the pregame assessment held up under the week's actual conditions.

Ad space

Margin of Victory — Philadelphia Eagles (Home)

Pregame odds for every possible outcome, simulated before kickoff -- the highlighted bar is what actually happened.

Lost / Tied
34%
Won by 1-3 ← actual result
9%
Won by 4-7
12%
Won by 8-14
19%
Won by 15-21
14%
Won by 21+
12%

Total Score — Over / Under

Combined final score against five common lines, plus this game's actual market line -- the real combined score was 46.

O/U LINE 30
86% over ✓14% under
O/U LINE 40
63% over ✓37% under
O/U LINE 44
51% over ✓49% under
O/U LINE 44.5 MARKET LINE
50% over ✓50% under
O/U LINE 48
40% over60% under ✓
O/U LINE 52
29% over71% under ✓
🔒

Unlock Full Game Stats

Margin-of-victory breakdowns and total-score probabilities for every game are a free-account feature. This one's part of the paid slate — the Game of the Week is always free to view in full.

Sign Up Free
Every number above comes from the model's live prediction data — 100,000 Monte Carlo simulations, grounded in the market line at generation time.

Ad space

Highest Graded Players

Season-to-date PFF grades for each team's top graded players, minimum 25% of that side's snaps.

WAS
Sam CosmiG
80.8
Jayden DanielsQB
77.3
Antonio WilliamsWR
72.7
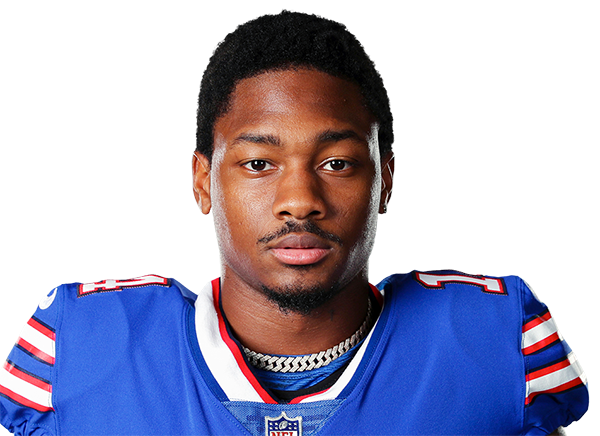
Stefon DiggsWR
66.8
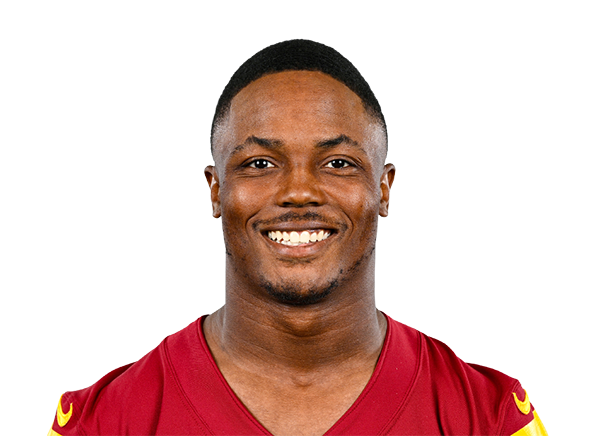
Terry McLaurinWR
66.7
PHI
DeVonta SmithWR
90.5
Jordan MailataT
80.6
Lane JohnsonT
79.8
Dallas GoedertTE
76.2
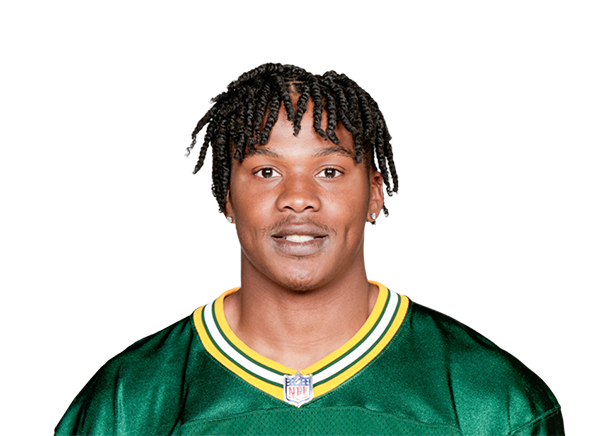
Dontayvion WicksWR
68.9

QB Matchup

Each team's real current starting QB (per PFF's own depth chart) -- season-to-date PFF grades and passing profile, ranked against the league's other starters. A stat reads “—” when that player has no recorded snaps for it yet this season (e.g. just back from injury).

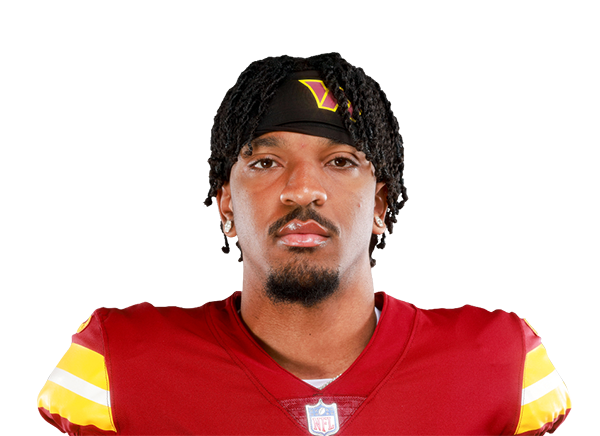
WASJayden Daniels
VS
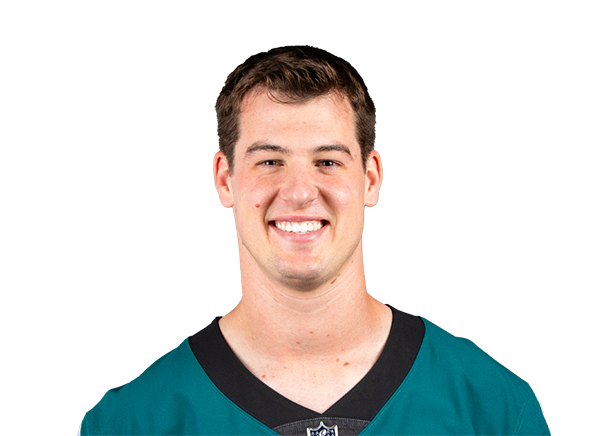
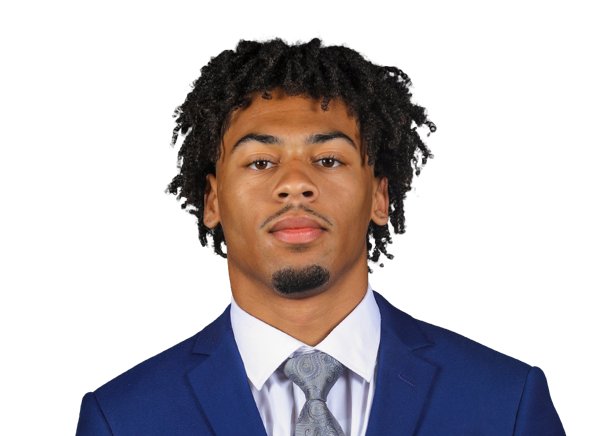
PHITanner McKee
WAS
77.3
12th / 35
Overall Grade
PHI
70.9
of 35
WAS
84.8
15th / 35
Clean Pocket Grade
PHI
75.8
of 35
WAS
34.9
28th / 35
Pressure Grade
PHI
55.0
of 35
WAS
1.2%
34th / 35
Big Time Throw %
PHI
2.1%
of 35
WAS
1.0%
4th / 35
Turnover Worthy %
PHI
0.0%
of 35
WAS
3.16s
30th / 35
Avg Time To Throw
PHI
2.30s
of 35
WAS
9.2
8th / 35
Avg Depth of Target
PHI
8.4
of 35

Efficiency and Scoring

Season-to-date EPA, success rate, and scoring, with each figure's league rank.

Offense
WASPHI
+0.0015th/32
EPA / Play
-0.1330th/32
+0.0916th/32
EPA / Play (Passing)
-0.1225th/32
-0.1222nd/32
EPA / Play (Rushing)
-0.1727th/32
40.6%25th/32
Success Rate
39.4%31st/32
44.6%20th/32
Success Rate (Passing)
40.1%29th/32
34.6%30th/32
Success Rate (Rushing)
38.1%25th/32
23.017th/32
Points Per Game
18.429th/32
Defense
WASPHI
+0.0523rd/32
EPA / Play
+0.0826th/32
+0.1726th/32
EPA / Play (Passing)
+0.1324th/32
-0.191st/32
EPA / Play (Rushing)
+0.0131st/32
47.7%27th/32
Success Rate
45.1%19th/32
51.9%27th/32
Success Rate (Passing)
46.4%16th/32
39.3%8th/32
Success Rate (Rushing)
43.2%22nd/32
29.830th/32
Points Per Game
22.414th/32

Pressure Matchup

Each team's O-line pressure allowed against the other team's pass rush generated.

When Washington Commanders have the ball
WAS pressure allowed38.3%22nd of 32
→
PHI pressure generated32.9%25th of 32
When Philadelphia Eagles have the ball
PHI pressure allowed42.7%27th of 32
→
WAS pressure generated33.6%24th of 32

Team Grades

Both teams' own season-to-date PFF grades, side by side.

Grades ranked all 32 teams
WAS
63.7
30th / 32
Overall
PHI
70.2
26th / 32
WAS
65.3
24th / 32
Offense
PHI
66.7
23rd / 32
WAS
58.7
28th / 32
Defense
PHI
63.6
21st / 32
WAS
72.6
23rd / 32
Special Teams
PHI
75.6
21st / 32
WAS
68.4
18th / 32
Passing Offense
PHI
56.0
24th / 32
WAS
73.9
14th / 32
Rushing Offense
PHI
82.5
5th / 32
WAS
65.7
27th / 32
Receiving
PHI
66.7
25th / 32
WAS
57.9
28th / 32
Offensive Line
PHI
63.2
18th / 32
WAS
61.9
30th / 32
Pass Rush
PHI
64.3
29th / 32
WAS
52.8
23rd / 32
Coverage
PHI
58.4
18th / 32
WAS
59.6
21st / 32
Run Defense
PHI
64.6
13th / 32
🔒

Unlock Matchups & Betting Edge

PFF player grades, lineup matchups, and betting-line insights for every game are a free-account feature. This one's part of the paid slate — the Game of the Week is always free to view in full.

Sign Up Free